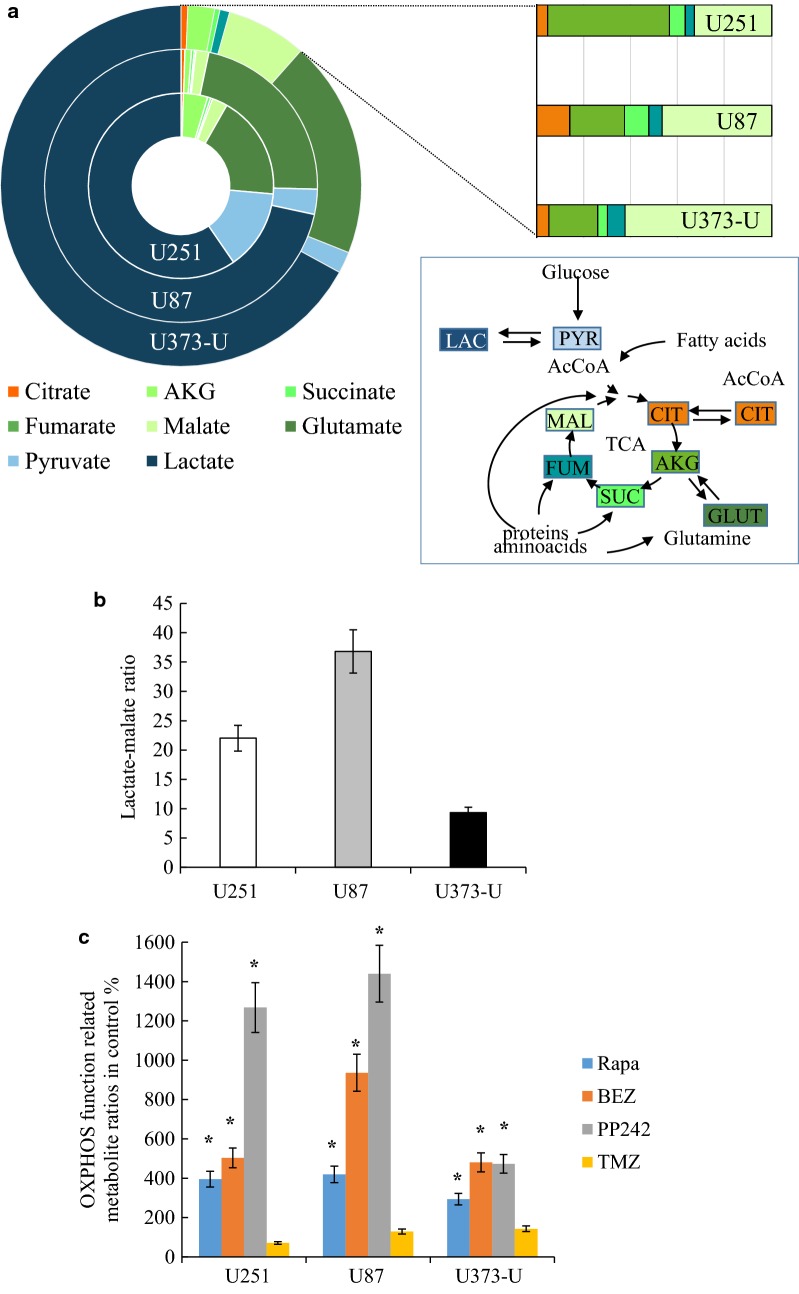
Fig. 2.
Intracellular metabolite concentrations in the studied three glioma cell lines. a High level of intracellular lactate or glutamate and differences in the concentration of other metabolites, such as pyruvate and several TCA cycle metabolites—metabolites were measured by LC–MS and the relative distributions of the detected LAC lactate, PYR pyruvate, CIT citrate, AKG α-ketoglutarate, SUC succinate, FUM fumarate, MAL malate, GLUT glutamate were given; b the highest lactate/malate ratio showed the highest glycolytic activity in U87 cells; c alterations in metabolite levels measured by LC–MS after 72-h mTORI and temozolomide treatments—(citrate/pyruvate)/(fumarate/succinate) ratios were given in untreated controls % to characterise OXPHOS function. Drugs were used in the following concentrations—rapamycin—Rapa 50 ng/mL; NVP-BEZ235—BEZ 1 µM; PP242 1 µM; temozolomide—TMZ 100 µM. Significant changes were labelled * (p < 0.05)

