Figure 1.
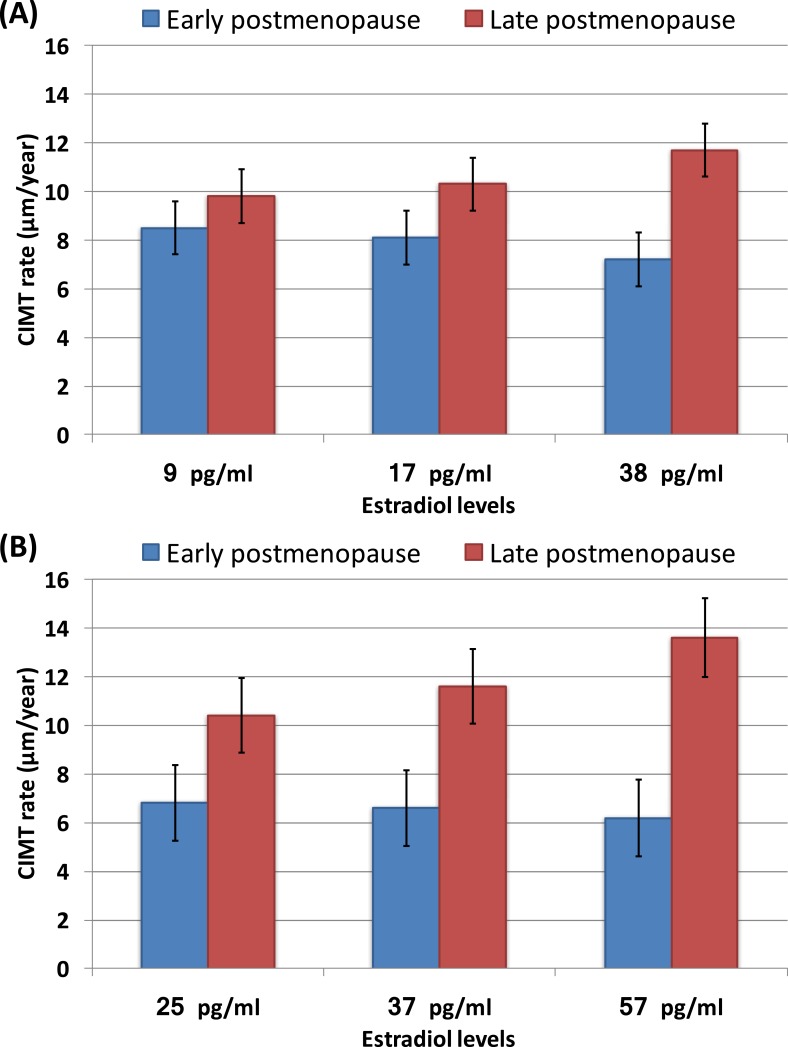
(A) Model-estimated CIMT progression rates at different quartiles of E2 level according to time since menopause strata among the total cohort. (B) Model-estimated CIMT progression rate at different quartiles of E2 level according to time since menopause strata among participants in the HT group. The lines represent standard error. Number of participants (%) in each quartile of E2: First-quartile HT group N = 10 (6.5%), placebo group N = 144 (93.5%); second-quartile HT group N = 21 (14.9%), placebo group N = 120 (85.1%); third-quartile HT group N = 122 (78.7%), placebo group N = 33 (21.39%); fourth-quartile HT group N = 144 (98.6%), placebo group N = 2 (1.4%). (A) Estimates of CIMT rate (with 95% CI) by E2 level: 25th percentile at 9 pg/mL: early postmenopause 8.5 (4.1, 12.8) μm/y, late postmenopause 9.8 (5.5, 14.1) μm/y (P = 0.18); 50th percentile at 17 pg/mL: early postmenopause 8.1 (3.8, 12.4) μm/y, late postmenopause 10.3 (6.1, 14.6) μm/y (P = 0.014); 75th percentile at 38 pg/mL: early postmenopause 7.2 (2.9, 11.5) μm/y, late postmenopause 11.7 (7.3, 16) μm/y (P < 0.0001). (B) Estimates of CIMT rate (with 95% CI) by E2 level: 25th percentile at 25 pg/mL: early postmenopause 6.8 (0.7, 12.9) μm/y, late postmenopause 10.4 (4.3, 16.4) μm/y (P = 0.0144); 50th percentile at 37 pg/mL: early postmenopause 6.6 (0.6, 12.6) μm/y, late postmenopause 11.6 (5.6, 17.6) μm/y (P < 0.0001); 75th percentile at 57 pg/mL: early postmenopause 6.2 (0.2, 12.2) μm/y, late postmenopause 13.6 (7.4, 20.0) μm/y (P < 0.0001).

