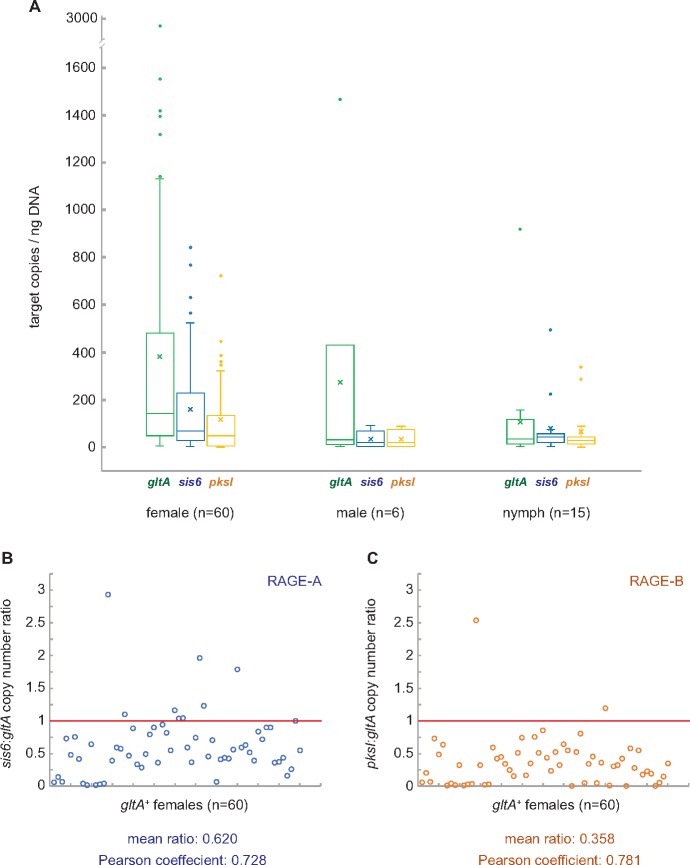
Fig. 5.
—RAGE-A and RAGE-B copy numbers are variable within individual Ixodes scapularis ticks. (A) Box-whisker plots of target copy numbers (normalized to DNA concentration) for gltA (chromosomal; green), sis6 (RAGE-A; blue), and pksI (RAGE-B; orange) targets within female (n=60), male (n=6), and nymph (n=15) ticks. Each box displays the first and third quartiles (top and bottom of the box, respectively), the mean (x), and the median (horizontal line). Upper and lower whiskers indicate the local maximum and local minimum, respectively. Outliers are displayed as individual dots. (B) Copy number ratios of sis6 (RAGE-A) to gltA (chromosomal) for Rickettsia buchneri populations within individual female I. scapularis. Each open circle (blue) represents the sis6:gltA ratio within a single tick. The expected ratio of 1 is shown by the red horizontal line. The mean ratio over all ticks and the Pearson coefficient of correlation between sis6 and gltA copy numbers are shown below the chart. (C) Copy number ratios of pksI (RAGE-B) to gltA (chromosomal) for R. buchneri populations within individual female I. scapularis. Each open circle (orange) represents the pksI:gltA ratio within a single tick. The expected ratio of 1 is shown by the red horizontal line. The mean ratio over all ticks and the Pearson coefficient of correlation between pksI and gltA copy numbers are shown below the chart.

