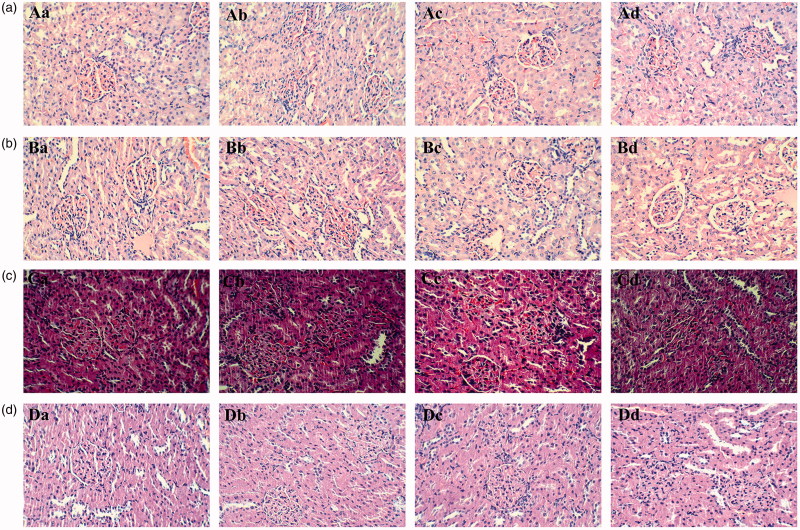
Figure 6.
Representative histopathology images of the kidney from the rats exposed to different doses of tsothel (66.70, 33.35 and 16.68 mg/kg) after 90, 135 and 180 days of administration and 30 days of drug withdrawal (N = 160). (A) Representative histopathology of the kidney after 90 days of administration. (B) Representative histopathology of the kidney after 135 days of administration. (C) Representative histopathology of the kidney after 180 days of administration. (D) Representative histopathology of the kidney after 30 days of drug withdrawal. Tissues were fixed in 4% paraformaldehyde and stained with haematoxylin and eosin. H&E stain, ×200 magnification. a: Control group; b: 66.70 mg/kg group of tsothel; c: 33.35 mg/kg group of tsothel; d: 16.68 mg/kg group of tsothel.

