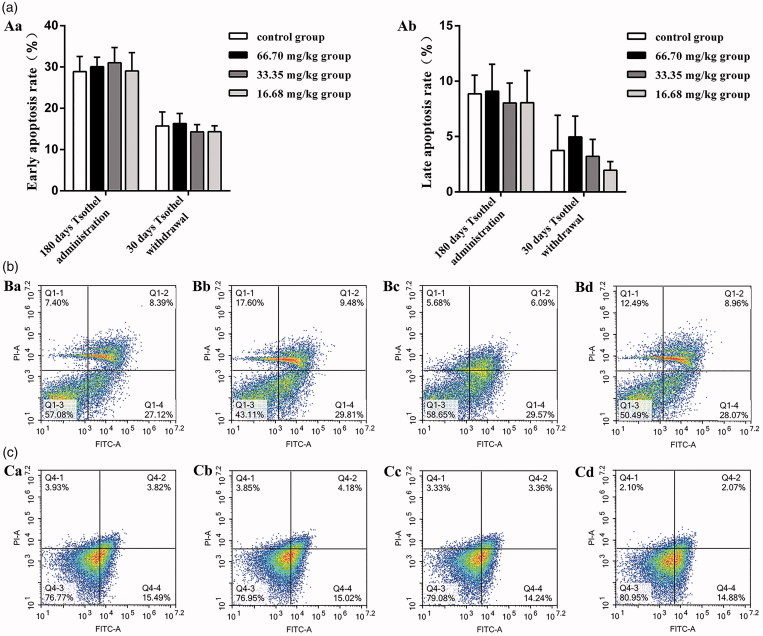
Figure 9.
Renal cell apoptosis (N = 160). (A) Apoptosis rate. Aa represents the early apoptosis rate, and Ab represents the late apoptosis rate. (B) Representative apoptosis flow cytometry diagrams of renal cells isolated from kidney tissue after 180 days of administration and analyzed by flow cytometry. (C) Representative apoptosis flow cytometry diagrams of renal cells isolated from kidney tissue after 30 days of drug withdrawal and analyzed by flow cytometry. Viable cells are in the lower left quadrant, early apoptotic cells are in the lower right quadrant, late apoptotic cells are in the upper right quadrant, and non-viable necrotic cells are in the upper left quadrant. Ba and Ca: Control group; Bb and Cb: 66.70 mg/kg tsothel group; Bc and Cc: 33.35 mg/kg tsothel group; Bd and Cd: 16.68 mg/kg tsothel group.

