
Figure 1.
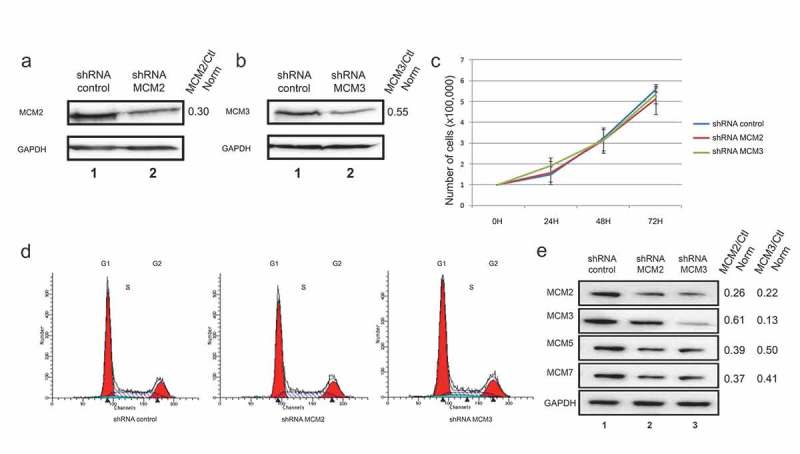
Lentivirus-infected cell lines expressing control, MCM2 or MCM3 shRNA. U2OS cells were infected with either a control shRNA, or shRNAs targeting and decreasing MCM2 (a) or MCM3 (b) expression. Cell extracts were resolved by SDS-PAGE and proteins revealed by immunoblotting using MCM2, MCM3 or GAPDH antibodies. The fold reduction compared to the control and normalized with GAPDH is shown on the right. (c) Growth curves of U2OS shControl, shMCM2 and shMCM3 cell lines over 72 h. A total of 100,000 cells were seeded at time 0, and counted every 24 hours (n = 3). (d) FACS analysis of cells expressing shControl, shMCM2 or shMCM3 using propidium iodine staining. (e) Cell extracts from U2OS cells expressing either a control shRNA, or shRNAs targeting MCM2 or MCM3 were resolved by SDS-PAGE and proteins revealed by immunoblotting using MCM2, MCM3, MCM5, MCM7 or GAPDH antibodies. The ratio compared to the control and normalized with GAPDH is shown on the right.