
Figure 3.
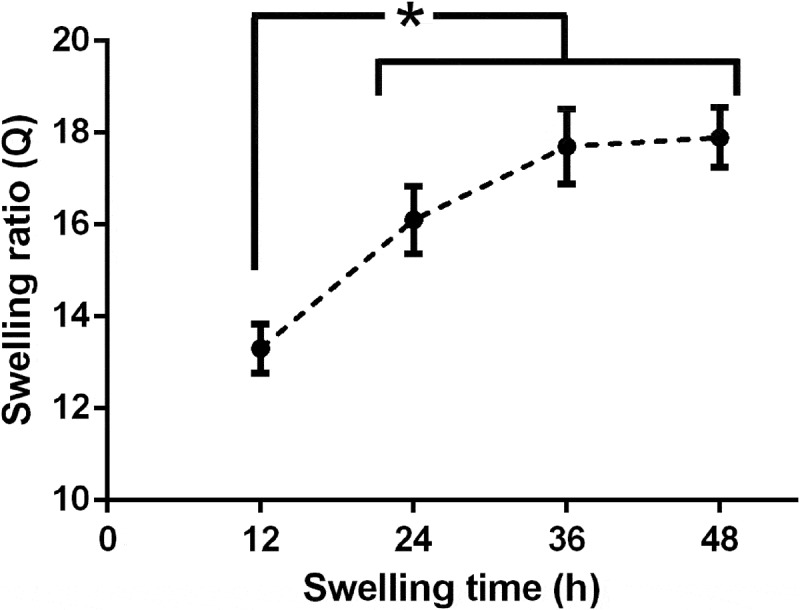
Mass swelling behaviour of NI 3 decellularised liver matrices. Black circles represent mean swelling ratio values (Q) at different time points, while error bars denote respective standard deviation. * = significant differences between samples (one-way ANOVA, p < 0.05).