
Figure 5.
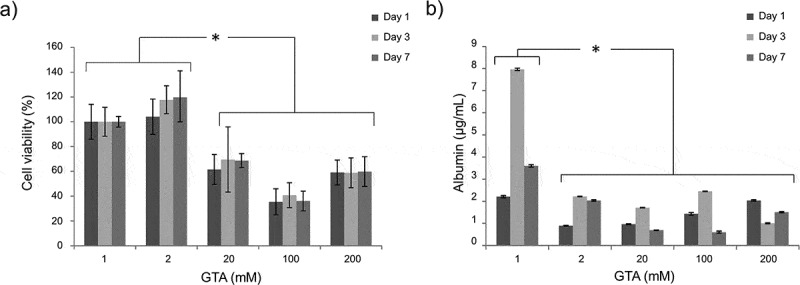
HepG2 viability (a) and albumin secretion (b) measured at different time points (day 1, 3, 7) on collagen scaffolds with different viscoelastic properties (here coded according to their GTA crosslinker concentration, Table 2). Statistical differences are denoted with an asterisk (p < 0.05).