
Figure 6.
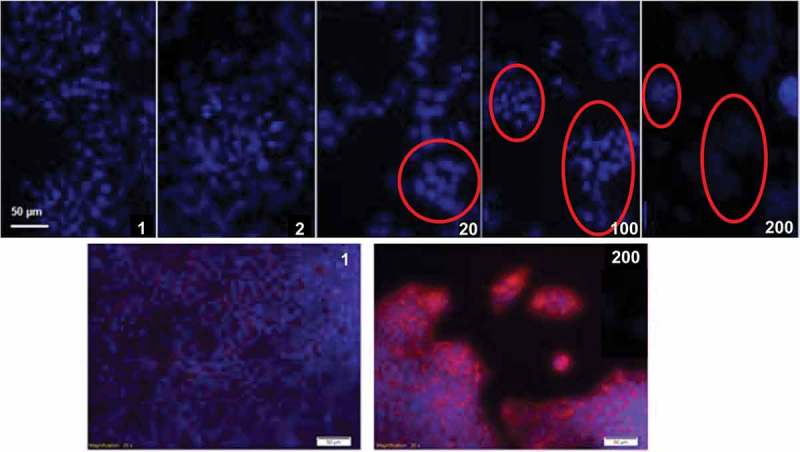
Immunofluorescent analyses of HepG2 cultured on collagen scaffolds with different viscoelastic properties (here coded according to their GTA crosslinker concentration, Table 2). Top row images show cell nuclei stained in blue (DAPI) at day 3. Cell clusters are highlighted with red circles. Bottom row images show HepG2 nuclei stained in blue (DAPI) and F-actin fibres stained in red (phalloidin) at day 7.