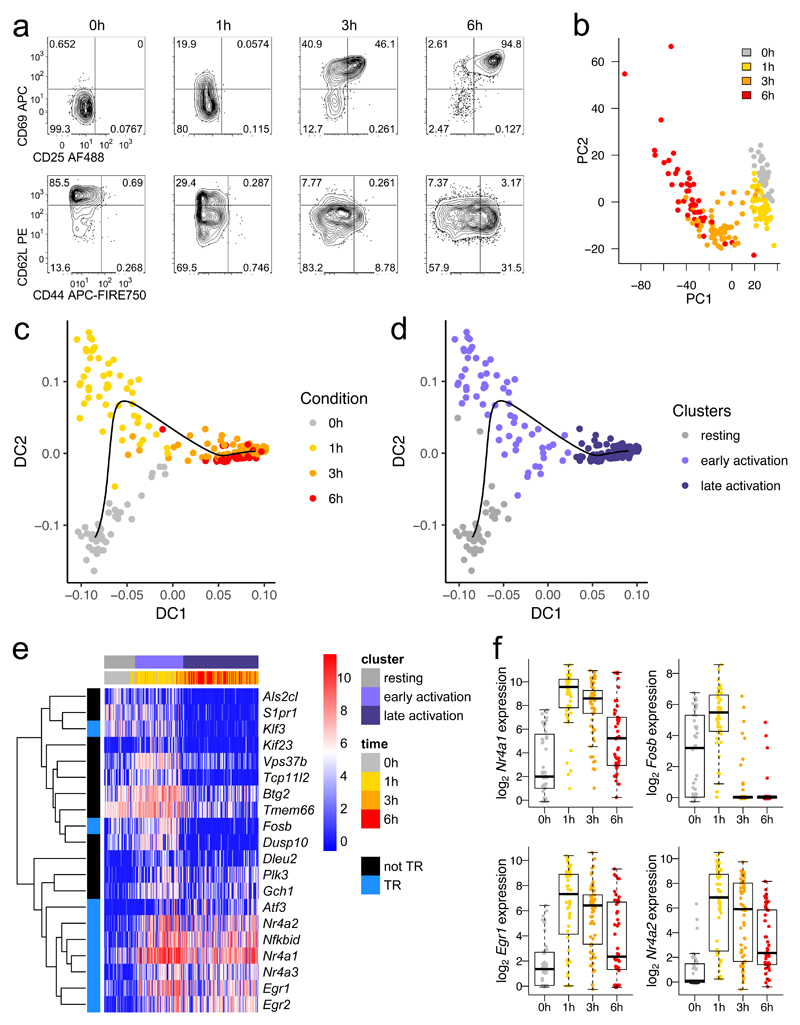
Fig. 1. A burst of transcriptional regulatory machinery characterizes early T cell activation.
a, OT-I CD8+ T cells were stimulated with high potency ovalbumin peptide (N4) for 0, 1, 3, or 6 hours before sorting for scRNA-seq by FACS. Protein expression flow cytometry measurements are representative of at least 2 independent experiments. b, Principal components analysis of scRNA-seq of cells sorted in a. c, Diffusion pseudotime analysis of sequenced cells: cells are plotted by diffusion components (DCs) 1 and 2, with a black line delineating the pseudotime trajectory. d, Plot in c is colored by clusters in diffusion pseudotime. e, The top 20 genes transcriptionally upregulated in the early activation cluster versus the resting and late activation clusters are depicted in a heatmap with genes clustered by Pearson correlation. Blue (TR) indicates transcriptional regulatory genes. f, Expression of selected transcription factors from e is shown with a box plot indicating the median, boxed interquartile range, and whiskers extending to the most extreme point up to 1.5 x the interquartile range. (b-f) n = 44 cells for 0h, 51 for 1h, 64 for 3h, and 46 for 6h.

