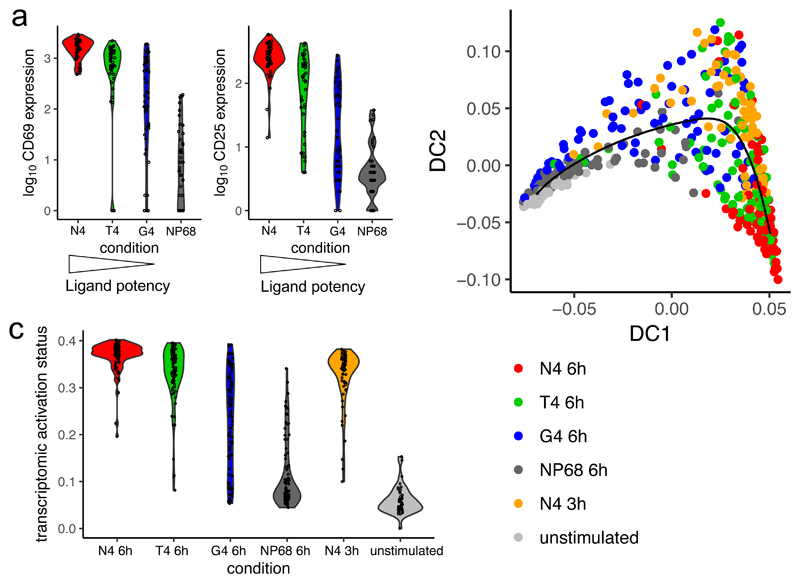
Fig. 3. Ligand potency determines activation rate.
OT-I CD8+ T cells were stimulated for 6 hours with the various peptide ligands or for 3 hours with high affinity (N4) peptide for scRNA-seq. a, Violin plots depict the distribution of surface protein expression measurements in sequenced cells stimulated for 6 hours; n = 45 cells for N4, 44 for T4, 48 for G4, and 47 for NP68. A second independent experiment is depicted in Supplementary Fig. 3a. b, An activation trajectory was fit to the transcriptomic data by diffusion pseudotime analysis; n = 91 cells for N4 6h, 91 for T4 6h, 94 for G4 6h, 93 for NP68 6h, 64 for N4 3h, and 44 for unstimulated. Plot depicts combined data from two independent scRNA-seq experiments. c, Distribution of cells along the pseudotime transcriptomic activation trajectory fit in b separated by stimulation condition.

