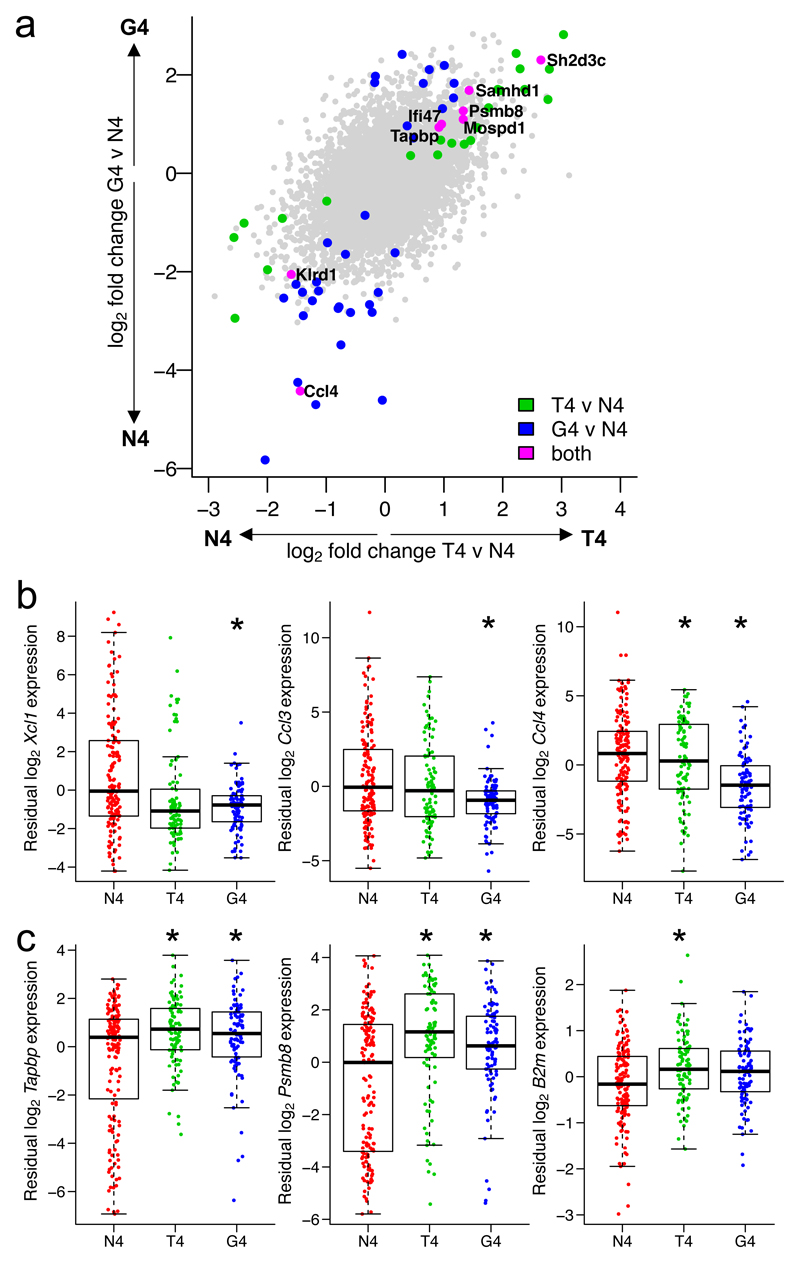
Fig. 4. Differential expression between cells activated by ligands of different potencies accounting for activation status.
a, Log2-fold changes from a differential expression analysis between T4 (medium potency) and N4 (high potency), or G4 (low potency) and N4, peptide stimuli in Fig. 3, accounting for each cell’s activation status as defined by log10 CD69 surface protein expression. Plot depicts all 8854 genes tested; differentially expressed genes (FDR < 0.05) for T4 versus N4 are shown in green; G4 versus N4, blue; intersection of T4 versus N4 and G4 versus N4, magenta and labelled. b, Residual expression of selected chemokine genes in scRNA-seq data after accounting for CD69 surface protein expression, plotted by stimulation condition. c, As b for selected genes associated with class I antigen presentation. (b-c) Box plots show the median, boxed interquartile range, and whiskers extending to the most extreme point up to 1.5 x the interquartile range; n = 155 cells for N4, 91 for T4, 94 for G4. * FDR < 0.05; statistical test described in Methods and statistics detailed in Supplementary Table 2.

