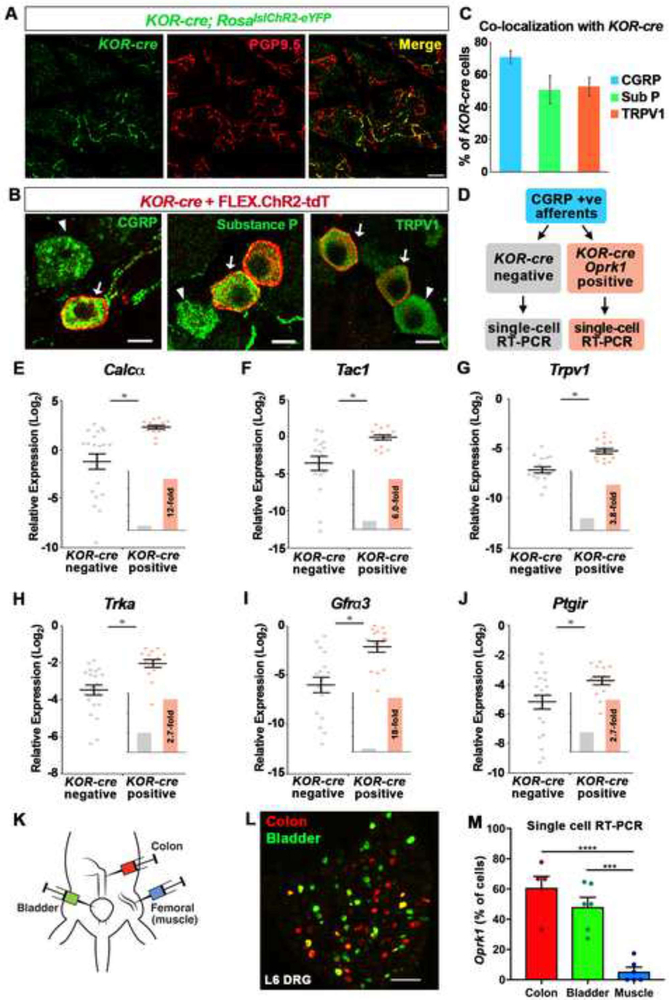
Figure 4. KOR is expressed by a transcriptionally distinct subset of peptidergic DRG neurons that preferentially target viscera.
A. Wholemount IHC of the thoracic skin from a KOR-cre; RosalslChR2-eYFP mouse showing that KOR-cre-positive afferents (green) make up a subset of free nerve endings that terminate in the epidermis, as assessed by co-localization with PGP9.5 (red). Scale bar = 10 μm.
B. IHC of DRG showing KOR-cre-labeled neurons co-localize with markers of peptidergic neurons. KOR-cre afferents were labeled with a Cre-dependent virus (AAV.FLEX.ChR2-tdTomato; IT in adult) Arrows indicate co-localization; arrowheads indicate CGRP-, Substance P- (SP), or TRPV1-expressing neurons that are not KOR-cre positive. Scale bar = 10 μm.
C. Quantification of (B) showing the percentage of KOR-cre + FLEX.ChR2-tdT cells that co-localize with peptidergic markers. Data are presented as mean ± SEM (n = 3 mice).
D. Schematic of single-cell RT-PCR experimental design. Lumbar DRG neurons from KOR-cre; RosalslChR2-eYFP mice were collected individually. Only peptidergic cells that expressed Calcα were analyzed. Transcript levels were compared between KOR-cre-labeled neurons that showed clear Oprk1 expression and KOR-cre negative neurons.
E - J. Expression levels of Calcα (E), Tac1 (F), Trpv1 (G) TrkA, (H), Gfrα3 (I) and Ptgir (J) mRNA relative to GAPDH in KOR-cre negative (gray) and KOR-cre positive (orange) DRG neurons. Data are presented as the -log2 ΔCT expression relative to GAPDH expression within the same cell such that larger numbers represent higher mRNA expression. There was a significantly higher relative expression level of each transcript in KOR-cre positive neurons compared to KOR-cre negative neurons (Student’s t-test, p < 0.05). Inset shows fold-increase in the average expression level normalized to the average expression in KOR-cre negative neurons. Black bars represent mean ± SEM and colored dots represent values from individual cells (n = 20 KOR-cre negative neurons, n = 15 KOR-cre positive neurons).
K. Cartoon illustrating the back-labeling of bladder, colon and muscle primary afferents using fluorophore-conjugated cholera toxin B and/or wheat germ agglutinin.
L. Image of L6 DRG in which colon afferents have been back-labeled with CTB-555 (red) and bladder afferents have been back-labeled with CTB-488 (green). Note, a small fraction of afferents dually innervate colon and bladder (yellow).
M. Analysis of Oprk1 expression by single cell RT-PCR in afferents that innervate bladder, colon, or muscle. The proportion of bladder afferents or colon afferents that express Oprk1 was significantly higher than the proportion of muscle afferents that express Oprk1. Data are presented as mean ± SEM and symbols represent data points from individual animals (*** < 0.001, **** < 0.0001, One-way ANOVA followed by Holm-Sidak test; n = 5 – 6 mice/condition with 9 – 22 cells per mouse).

