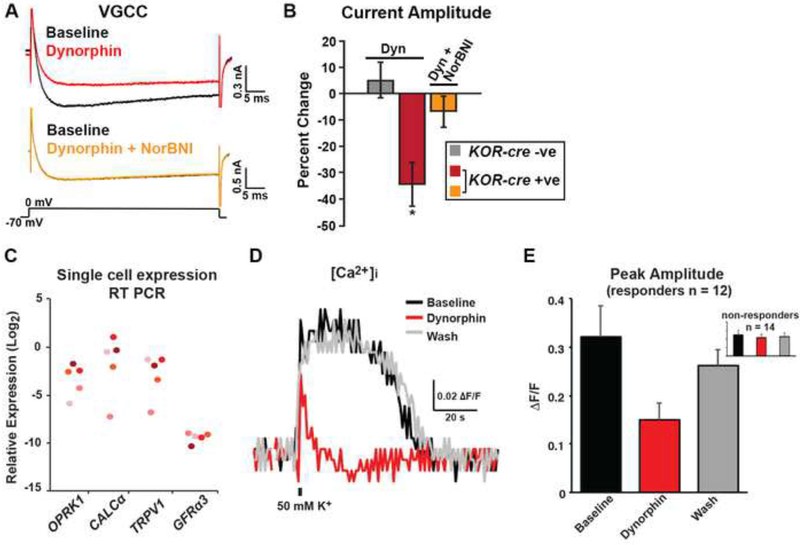
Figure 5. Activation of KOR inhibits voltage-gated Ca2+ currents in mouse DRG neurons and Ca2+ influx in human peptidergic DRG neurons.
A. Representative traces of voltage-gated Ca2+ currents (VGCC) in a genetically-labeled cell from a KOR-cre; Rosalsl-tdTomato mouse at baseline (black traces, top and bottom), in the presence of dynorphin (1 μm, red; top trace), and in the presence of dynorphin (1 μm) + norBNI (1 μm, yellow; bottom trace). Neurons were held at −70 mV and a 50 ms step to 0 mV was applied.
B. Quantification of the percent change in current amplitude of KOR-cre negative neurons (gray; n = 5), KOR-cre positive neurons in the presence of dynorphin (1 μm; red; n = 6), or KOR-cre positive neurons in the presence of dynorphin (1 μm) + norBNI (1 μm; orange; n = 3). There was a significant decrease in current amplitude in the presence of dynorphin in KOR-cre positive neurons (*, paired t-test, p < 0.05). Data are presented as mean ± SEM.
C. Expression levels of OPRK1, CALCα, TRPV1, and GFRα3 mRNA in human DRG neurons. Each neuron is represented by a different color. Data are presented as the -log2 ΔCT expression relative to GAPDH expression within the same cell such that larger numbers represent higher mRNA expression. All OPRK1-expressing cells expressed mRNA for the peptidergic markers CALCα, TRPV1, and GFRα3.
D - E. Representative traces (D) and quantification (E) of human DRG neuron Ca2+ responses to a brief (800 ms) application of high K+ evoked (50 mM) before (black), during (red) and after (gray) the application of dynorphin (1 μM). The response to dynorphin was significant (greater than 2 standard deviations of the baseline response) in 12 of 26 neurons from 4 donors. Inset shows 14 non-responders. Data are presented as mean ± SEM.

