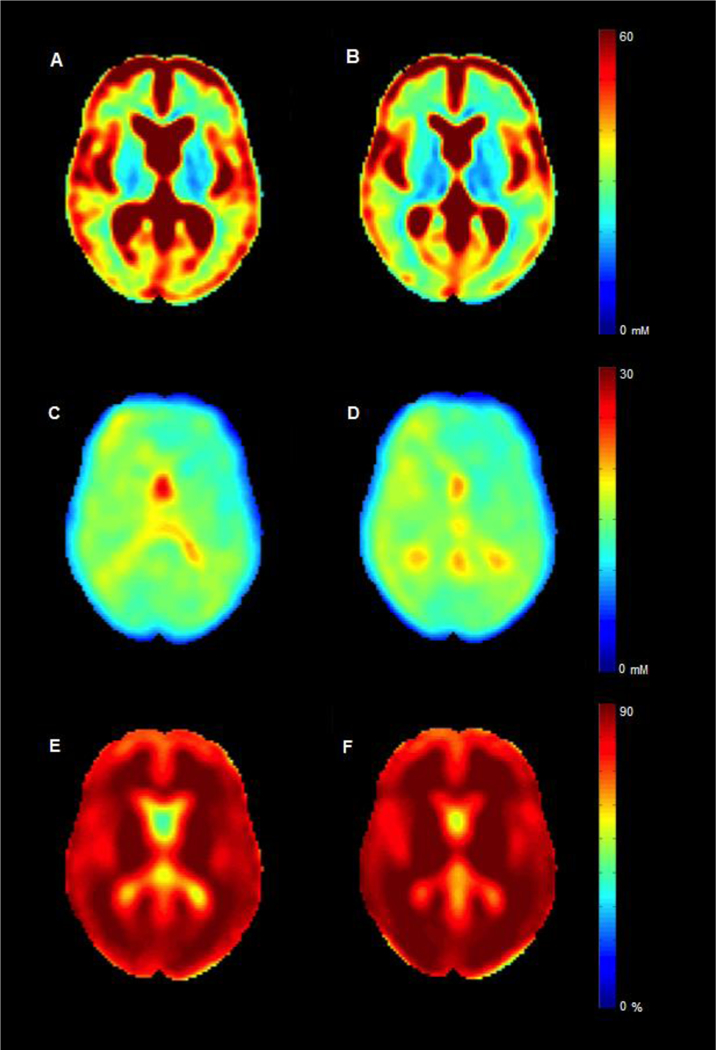
Figure 5.

23Na group maps. Mean to total sodium concentration (TSC), (intracellular sodium concentration) ISC and (intra- cellular sodium volume fraction) ISVF maps for patients with multiple sclerosis (respectively, A, C and E) and controls (respectively, B, D and F). In both groups, TSC appears higher while ISC and ISVF are lower in grey matter than in white matter. As intracellular molar content and cell volume are equal to zero in extracellular tissue, ISVF and ISC measurements in CSF are meaningless. Reproduced by Petracca et al. [67] by permission of Oxford University Press.
