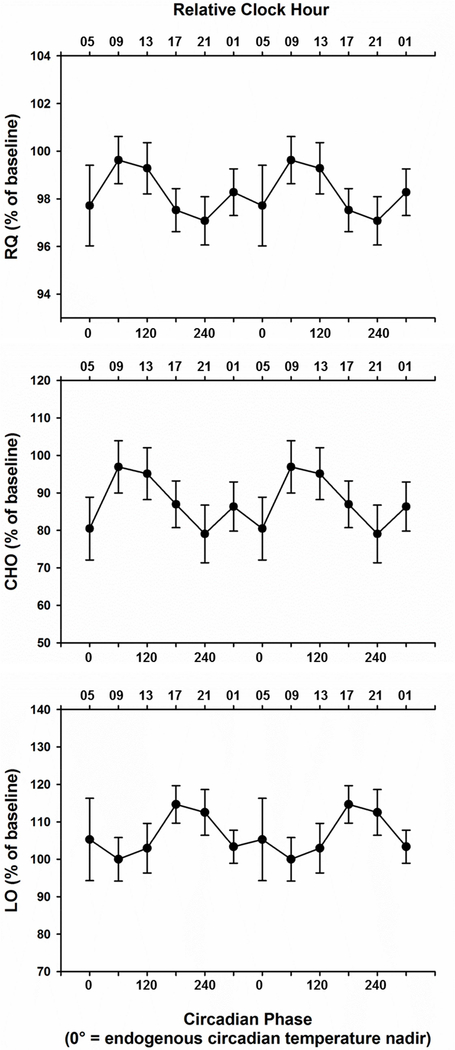
Figure 3. Circadian Variation of Fasting Respiratory Quotient, Carbohydrate, and Lipid Oxidation.
Top panel. Fasting Respiratory Quotient (RQ), the ratio of oxygen consumption and carbon dioxide production, is plotted with respect to the circadian phase at which it was measured. RQ is lowest at circadian phase 240° (corresponding to late biological evening) and highest at circadian phase 60°, which corresponds to biological morning. Changes in RQ level reflect macronutrient metabolism; higher RQ favors carbohydrate oxidation whereas lower RQ favors lipid oxidation. Middle panel. Fasting Carbohydrate oxidation (CHO) is plotted with respect to the circadian phase at which it was assessed. CHO is highest at circadian phase 60° (corresponding to biological morning) and lowest at circadian phase 240° (corresponding to late biological evening. Bottom panel. Lipid Oxidation (LO) is plotted with respect to the circadian phase at which it was measured. LO is highest at circadian phase 180°, and lowest at circadian phase 60°. Data in all three panels are double-plotted and represented as mean ± SEM. For reference, a relative clock hour time scale illustrating the approximate time of day is shown on the upper axis, with 05:00 referenced to the endogenous circadian temperature nadir in this group of older individuals. See also Figure S2 and Figure S3.

