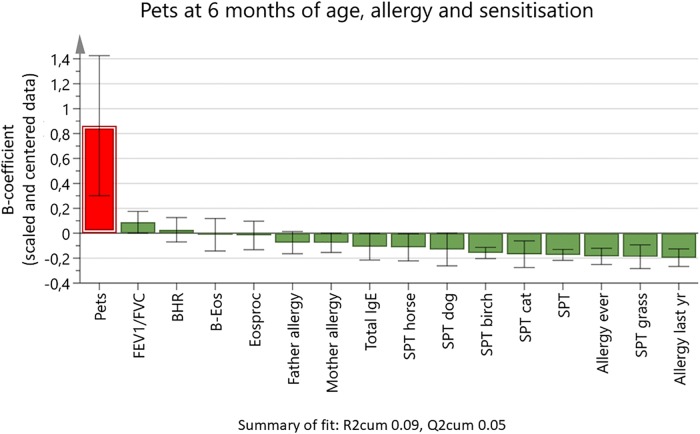
Fig 3. Orthogonal projection to latent structures loading plot showing associations between the number of household cats and dogs when the child was 6 months old (Y variable), and a set of 15 X variables.
The outcome variables for lung function (forced expiratory volume in 1 s [FEV1]/forced vital capacity [FVC]), bronchial hyperresponsiveness (BHR), blood eosinophil count (B-Eos), percentage of blood eosinophils (Eosproc), total immunoglobulin (IgE), and skin-prick tests (SPTs) were from the age 8–9 years follow-up. SPTs are given as weal diameter. X variable bars pointing in the same direction as the Y variable are positively associated with the Y variable, and bars pointing in the opposite direction are negatively associated. The height of the bars shows the B-coefficients for scaled and centered data, with 95% confidence intervals.

