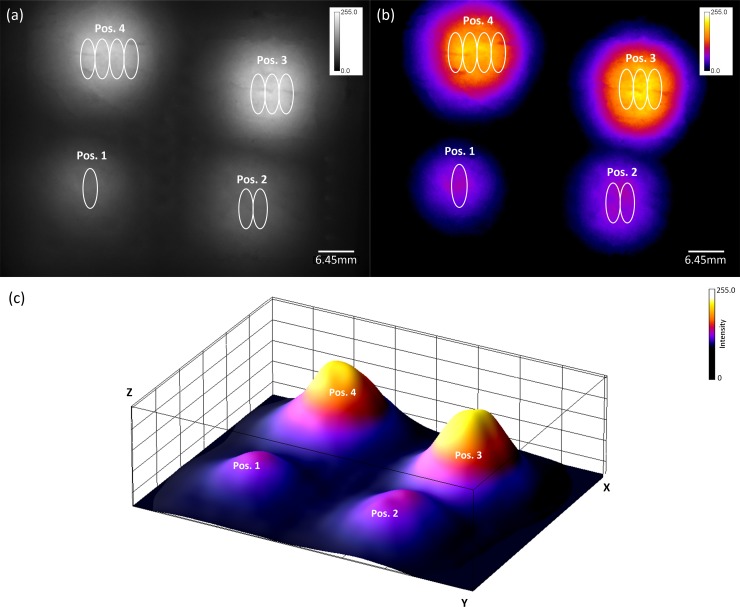
Fig 4. Results of the tissue area scan.
(Fig 4A) Tissue scan of an area of 10 cm × 6.6 cm with four differently sized tumor phantoms (phantom sizes: Position 1, 7 × 2 mm; Position 2, 7 × 4 mm; Position 3, 7 × 6 mm; Position 4, 7 × 8 mm) with an exposure time of 100 ms at a depth of 22 mm. (Fig 4B) False-colored image of the scanned tissue sample recorded using the developed laser scanner. (Fig 4C) Three-dimensional surface plot of the detected tumor phantoms.

