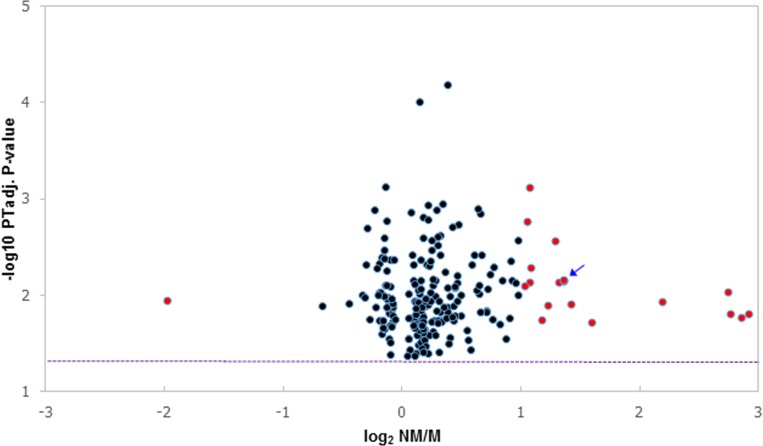
Fig 1. Genes exhibiting differential expression between metastasising and non-metastasising MCTs.
Expression of 218 genes in 18 metastasising (M) and 16 non-metastasising (NM) MCTs. Each sphere represents an individual gene. The difference in expression between the M and NM MCTs is represented (x-axis) by the log2-transformed fold-change (NM/M). Red spheres denote the 19 genes which exhibit a difference in expression of ≥2.0 (either NM>M, or M>NM). The arrow indicates two genes which cannot be resolved by their x, y co-ordinates. The statistical significance of differences in expression between NM and M MCTs is denoted (y axis) by the minus log10-transformed permutation testing-adjusted unpaired t-test derived p-values. A -log10 PTadj. p-value equivalent to a PTadj. p-value = 0.05 is indicated by the dotted line.

