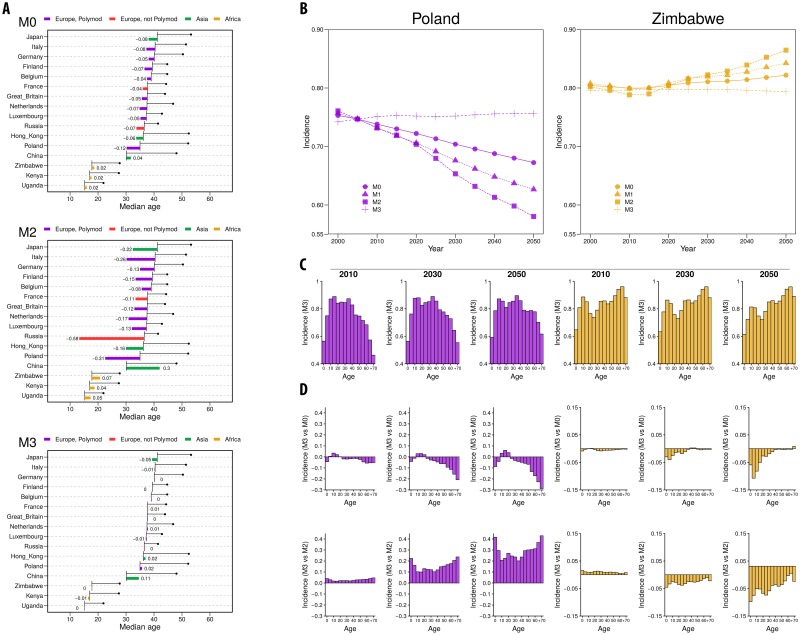
Fig 5. SEIR dynamics (scenario 2).
A: Median age at 2000 and 2050 (black line, beginning with the value at 2000 and ending with a bullet point with the value at 2050) for the 16 geographic settings considered and relative variation in incidence over the same period (colored bars), for M0, M2 and M3. B: Incidence (over all ages) vs Year for Poland (purple) and Zimbabwe (orange) using M0, M2 and M3. C: Incidence by age group for Poland and Zimbabwe in 2010, 2030 and 2050 using M3. D: Relative differences of the incidence by age group of M0 and M2 with respect to M3 ( and ).

