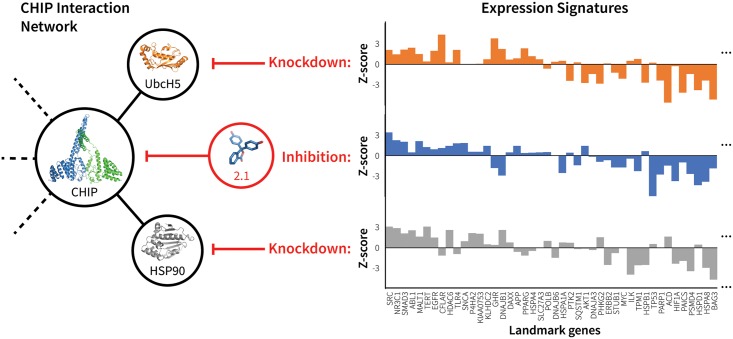
Fig 6. mRNA expression signature of CHIP inhibitor 2.1 correlates with knockdown of CHIP interacting partners.
The figure illustrates the correlation between the mRNA expression profile signatures produced by treating cells with 2.1 and by knocking down CHIP interaction partners UbcH5 and HSP90. These three perturbations have similar network effects (left), as illustrated by their resulting differential expression signatures (right). For clarity, expression signatures show only the subset of LINCS landmark genes that are functionally related to CHIP according to BioGRID [32].

