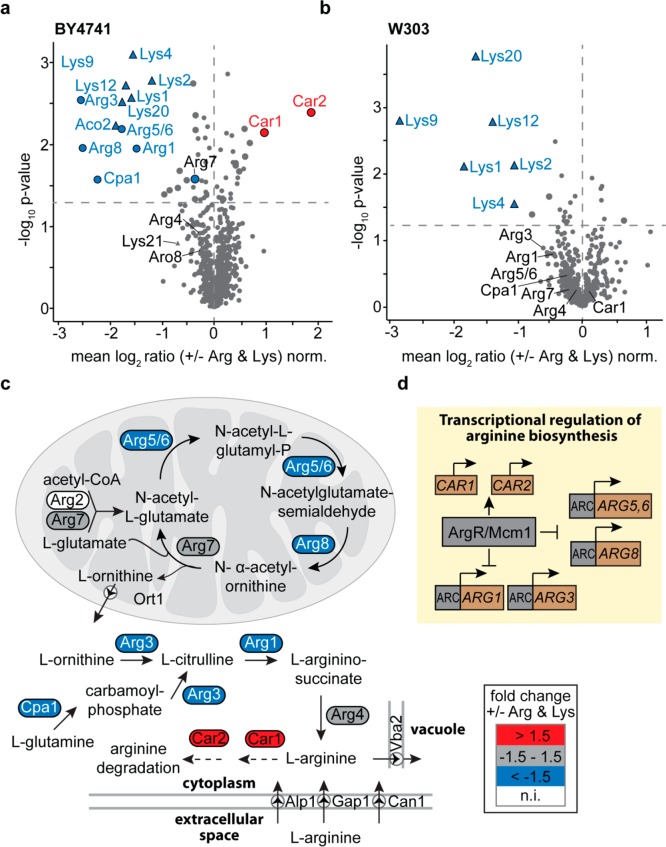
Figure 1.
Regulation of arginine and lysine biosynthetic enzymes in prototrophic yeast strains. (a, b) BY4741 and W303 cells were grown in in the presence (+) or absence (−) of external arginine (Arg) and lysine (Lys). For quantitative proteome analysis, stable isotope peptide dimethyl labeling was performed followed by LC-MS (n = 3). Proteins of the arginine (circles) and lysine (triangles) metabolic pathways are labeled. Larger symbols (blue, red, or gray) indicate proteins significantly down-/up-regulated (i.e., both t-test and Significance B p-value <0.05). Dashed horizontal lines mark the t-test p-value of 0.05. (c) Arginine biosynthesis pathway in S. cerevisiae. Colors indicate relative protein abundances of enzymes of the arginine biosynthesis and degradation as determined in (a). n.i., not identified. (d) Transcriptional regulation of the arginine biosynthesis pathway.66 ARC, arginine control elements.

