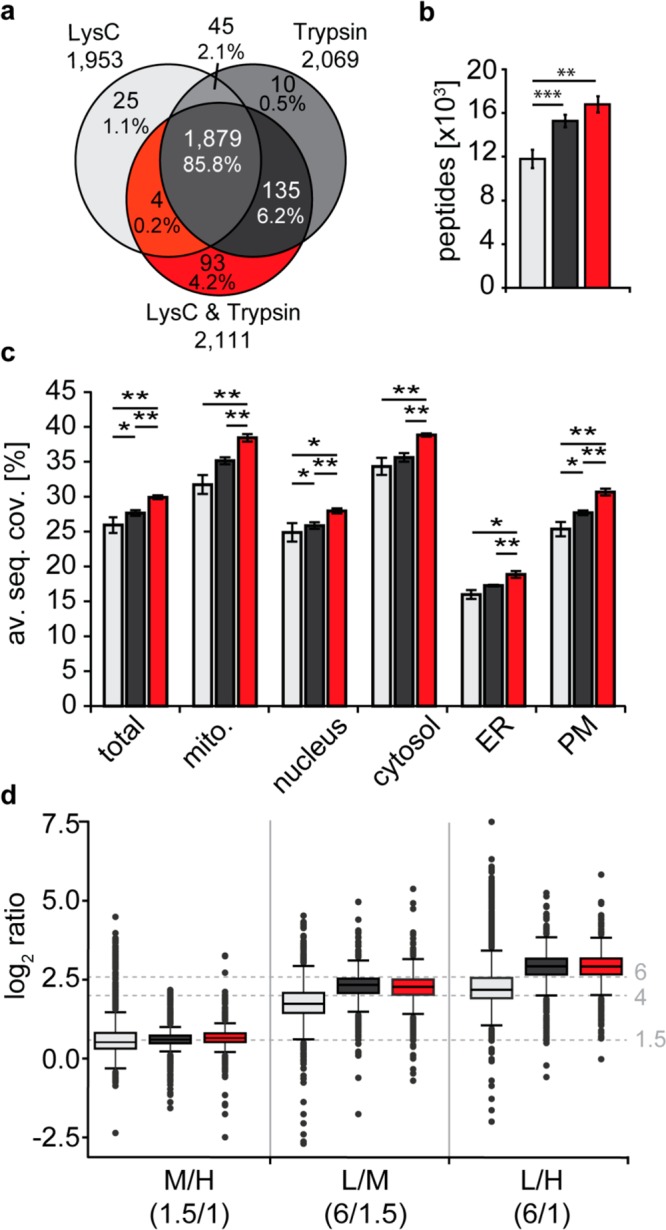
Figure 3.

Evaluation of 2nSILAC for quantitative proteome analysis. BY4741 cells labeled with stable isotope-coded lysine (Lys4, Lys8) only or lysine and arginine (Arg6, Arg10) and unlabeled cells (Arg0, Lys0) were mixed 6:1.5:1 (L/M/H; n = 4). Proteins were digested with LysC (nSILAC using lysine only) or trypsin or a combination of both proteases in case of 2nSILAC. (a, b) Overlap of proteins (a) and average number of peptides (b) identified by LC-MS. (c) Average sequence coverage (av. seq. cov.) of proteins of different subcellular localization. ER, endoplasmic reticulum; mito., mitochondria; PM, plasma membrane. (d) Accuracy of relative protein quantification. Dashed horizontal lines mark the experimental mixing ratios. (b, c) *p-value < 0.05; **p-value < 0.01; ***p-value < 0.001; error bars, std. dev.
