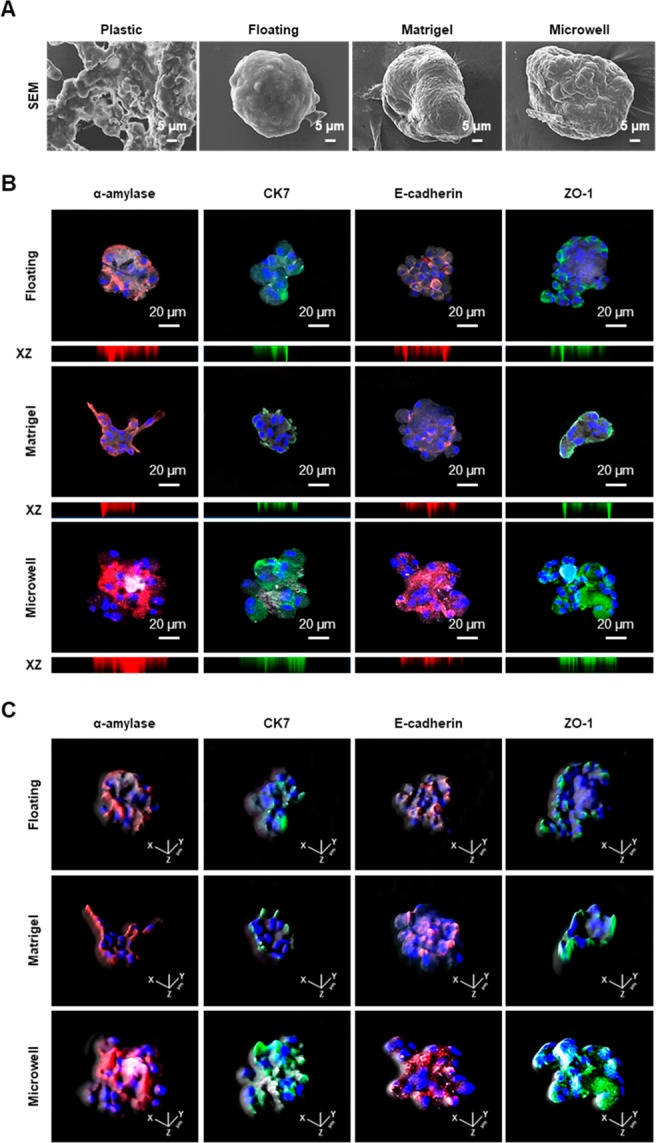
Figure 3.

Changes in the structures and phenotypes of SGSCs upon 3D organization induction. (A) Representative scanning electron microscopy image of 3D spheroidal structures upon differentiation induction of SGSCs in the floating, matrigel, and microwell cultures. Scale bars = 5 μm. (B) Immunofluorescence staining for salivary cellular markers in 3D organoids. Salivary acinar markers, α-amylase (red), ductal marker, CK7 (green), adherence protein, E-cadherin (red), and the tight junction (TJ) protein ZO-1 (green). The expression levels of α-amylase, CK7, E-cadherin, and ZO-1 were enriched in 3D spheroid cultures. Nucleic acids were stained with DAPI (blue). The scale bars represent 100 μm in 3D spheroid cultures. Confocal z-stack images with xz axis show the even distribution of all salivary epithelial markers in 3D spheroids. (C) Salivary structural proteins were uniformly observed in 3D spherical structures.
