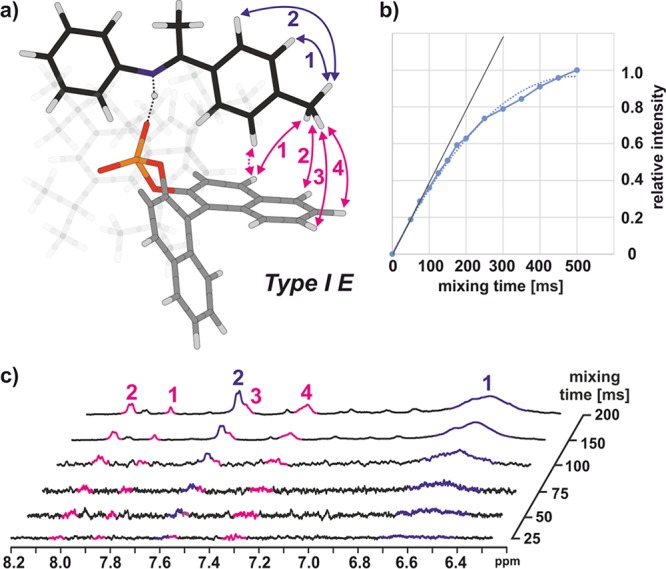
Figure 9.

(a) Calculated structure and experimental NOEs of a type I E binary complex. (b) NOE buildup curve. (c) Stacked plot showing the 1D selective NOESY spectra at 180 K in CD2Cl2 with different τmix. Adapted from ref (34). Copyright 2016 American Chemical Society.
