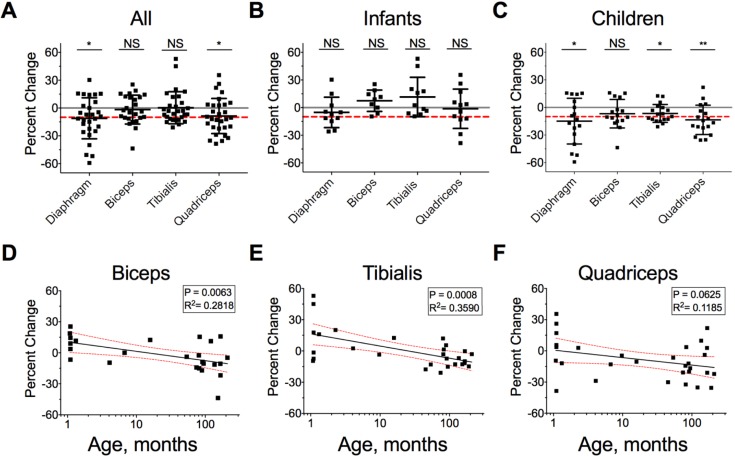
Fig 3. Change in muscle thickness and correlation with age in critically-ill children.
A-C. Percent change in muscle thickness in the four examined muscle groups in all patients (A), infants < 1 yr of age (B), and children > 1 yr of age (C). Scatter data are shown with mean ± SD. The red line indicates a 10% decrease in thickness. The gray line indicates zero for convenience. *WSRT p < 0.05. D-F. Simple linear regression of percent change in muscle thickness as a function of age in months for the Biceps (D), Tibialis (E) and Quadriceps (F). Red dashed lines indicate 95% CI for the slope.

