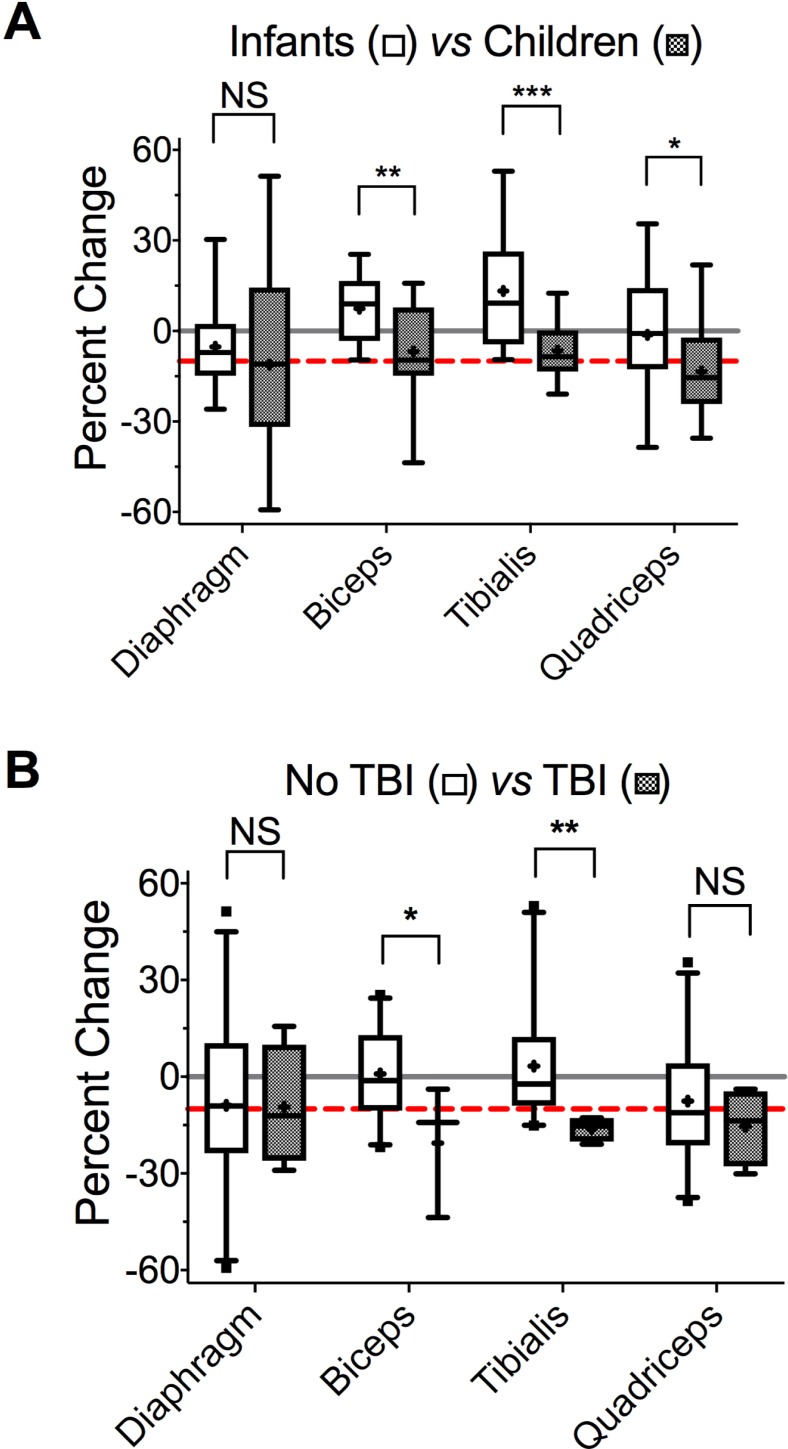
Fig 4. Effect of age group and TBI on change in muscle thickness in critically-ill children.
A. Change in muscle thickness in infants < 1 yr of age (open) and in children > 1 yr of age (closed). *p = 0.084, **p = 0.025, ***p = 0.002, paired t-tests. To account for multiple comparisons, discovery (q) was determined using the two-stage linear step-up procedure of Benjamini, Krieger and Yekuteli (BKY) with FDR = 10%; *q = 0.061, **q = 0.028, ***q = 0.005. B. Change in muscle thickness in patients without TBI (open) and with TBI (closed). *p = 0.022, **p = 0.038, t-tests. Similar to A, discovery was determined with BKY and FDR 10%; * and **q = 0.043. For both A and B, dashed red line indicates a 10% decrease, and solid gray line–zero. Box boundaries represent 25th and 75th percentiles, whiskers– 5th and 95th percentiles.

