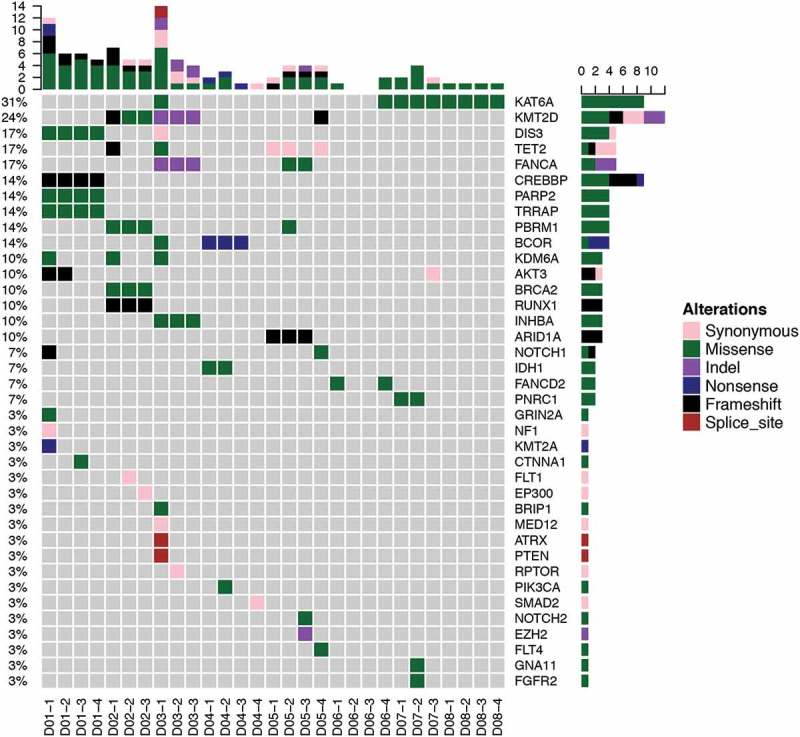
Figure 1.

Mutation spectrum. Mutations detected from every sample of PACC patients. Different colors represent different types of mutations. Top bars represent total number of mutations a sample carries; side bars total number of samples with mutation in that particular gene.
