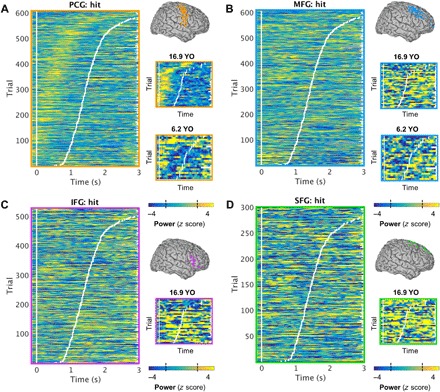
Fig. 2. Frontal activity on subsequent hit trials by region of interest.

(A) Left: Vertically stacked single hit trials for all subjects sorted by RT (white tick marks), averaged over all active PCG electrodes per subject. Scene onset is indicated by the vertical white line at time = 0 s. Single-trial PCG activity (i.e., z-scored power values compared with a baseline distribution) preceded the response onset (z > 2.57, P < 0.01). Right: Representative electrode-sample single trials for two subjects aged 16.9 and 6.2 years, showing similar activation patterns regardless of age. The dashed lines on the color bar indicate the threshold of significance (|z| > 1.96, P < 0.05). YO, years old. (B) Equivalent to (A): MFG activity was sustained following the response onset. (C) Equivalent to (A): IFG activity was sustained following the response onset. (There was no IFG or SFG coverage in the youngest subject.) (D) Equivalent to (A): SFG activity was sustained following the response onset.
