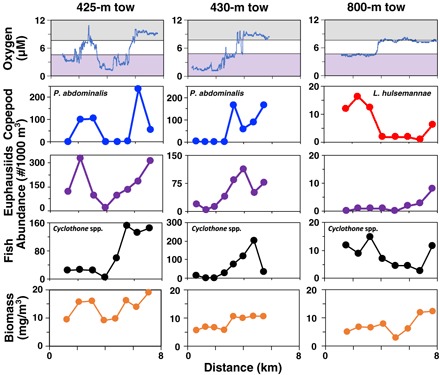
Fig. 3. Zooplankton abundances, biomass, and oxygen from MOCNESS horizontal tows.

Each column shows data from one tow. For oxygen (top row), purple shading indicates low oxygen (≤5 μM, 0.11 ml/liter), and gray shading indicates high oxygen (≥8 μM, 0.18 ml/liter). For copepods (second row), Pleuromamma abdominalis is shown for shallower tows and L. hulsemannae is shown for the deep tow. The next rows show total euphausiids, the fish Cyclothone spp., and zooplankton biomass. All graphed taxa show significant abundance differences between samples in high versus low oxygen categories (see table S2 for data in each category), except 800-m euphausiids and 800-m total biomass (which are sparse at depth) (see fig. S2 for photographs of these taxa).
