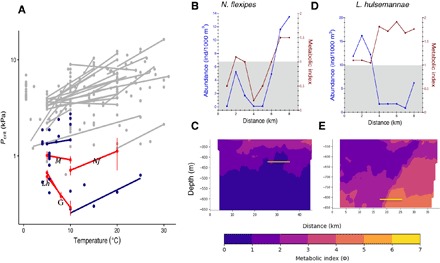
Fig. 5. Hypoxia tolerance influences the abundance of dominant mesopelagic crustaceans in the OMZ.

(A) Critical PO2 (Pcrit, kPa) in diverse marine crustaceans (gray; table S4), including species from the current study (L. hulsemannae, Lh; N. flexipes, Nf; Gennadas spp., G; and Megacalanus spp., M; red, means ± SE; table S3) and from the eastern Pacific OMZ (blue). Lines connect intraspecific measurements at different temperatures. Note that the y axis is on a log scale. (B to E) MI calculated for N. flexipes (B and C) at 400 m and L. hulsemannae (D and E) at 800 m from metabolic and environmental data across the horizontal MOCNESS [red lines in (B) and (D)] and Wire Flyer transects (C and E). The yellow line on MI plots illustrates the corresponding MOCNESS tows. The corresponding abundance of each species is also plotted [blue lines in (B) and (D)]. Gray shading (B and D) indicates metabolically unavailable habitat (MI < 1).
