
FIGURE 2.
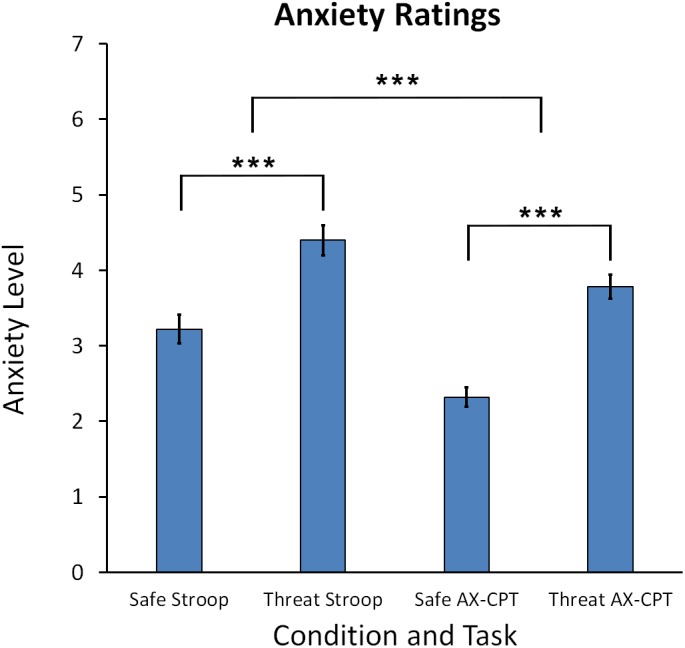
Mean anxiety ratings for the Stroop task and AX-CPT task. Error bars represent the standard error of the mean. Asterisks represents a significant difference. ∗∗∗p < 0.001.
Official websites use .gov
A
.gov website belongs to an official
government organization in the United States.
Secure .gov websites use HTTPS
A lock (
) or https:// means you've safely
connected to the .gov website. Share sensitive
information only on official, secure websites.
Mean anxiety ratings for the Stroop task and AX-CPT task. Error bars represent the standard error of the mean. Asterisks represents a significant difference. ∗∗∗p < 0.001.