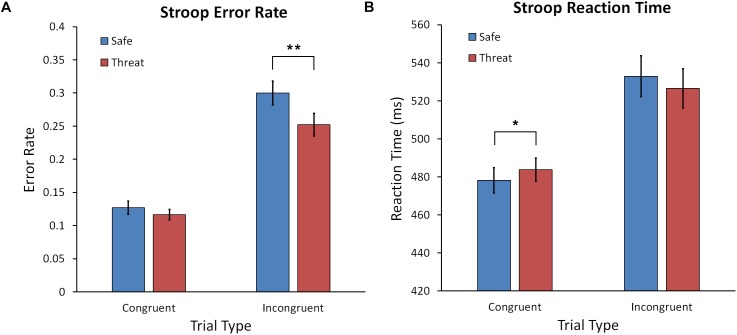
FIGURE 3.
(A) Mean error rate for the Stroop task for the safe and threat of shock conditions for congruent and incongruent trials. (B) Mean reaction time for the Stroop task for safe and threat of shock conditions across trial types. Error bars represent the standard error of the mean. Asterisks represents a significant difference. ∗p < 0.05; ∗∗p < 0.01.

