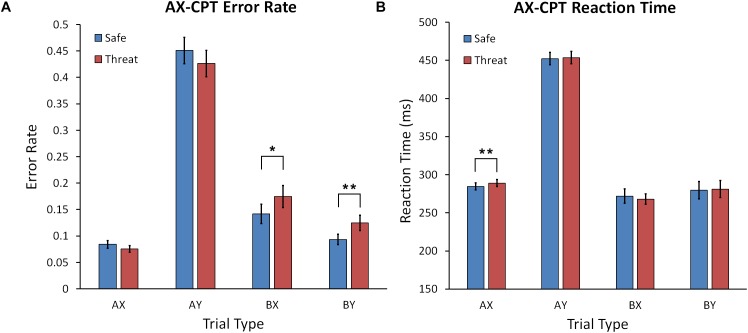
FIGURE 4.
(A) Mean error rate for the AX-CPT task for safe and shock conditions across trial types. (B) Mean reaction time for the AX-CPT task for safe and shock conditions for all trial types. Error bars represent the standard error of the mean. Asterisks represents a significant difference. ∗p < 0.05; ∗∗p < 0.01.

