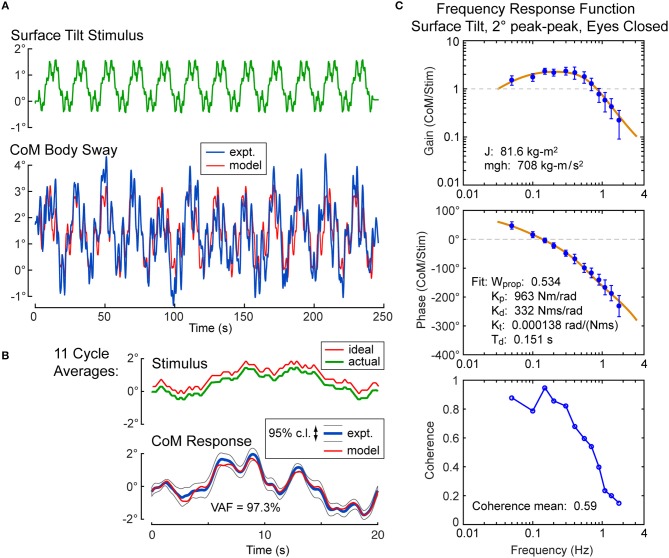
Figure 3.
Example single-subject data and data analysis of center-of-mass (CoM) sway evoked by a surface-tilt stimulus with 2° peak-to-peak amplitude during eyes closed stance. Twelve cycles of the surface-tilt stimulus and the corresponding evoked CoM sway are shown (A). Averaging across the last 11 cycles of the stimulus and sway response reveal the close correspondence between stimulus and response (B). A frequency response function represented by gain and phase functions [mean values ±95% confidence limits; see (30)] characterize the balance control dynamics of this individual on this particular test with a coherence function providing information on signal-to-noise quality (C). The solid lines through the frequency response data are based on model parameter estimates. Model-predicted CoM sway based on identified parameters is shown in (A,B) with a variance accounted for (VAF) measure showing that the model accounts for most of the experimental stimulus evoked sway. Comparison of the actual and ideal stimulus (ideal is offset from the actual for comparison) in (B) demonstrates the accurate delivery of the desired stimulus.

