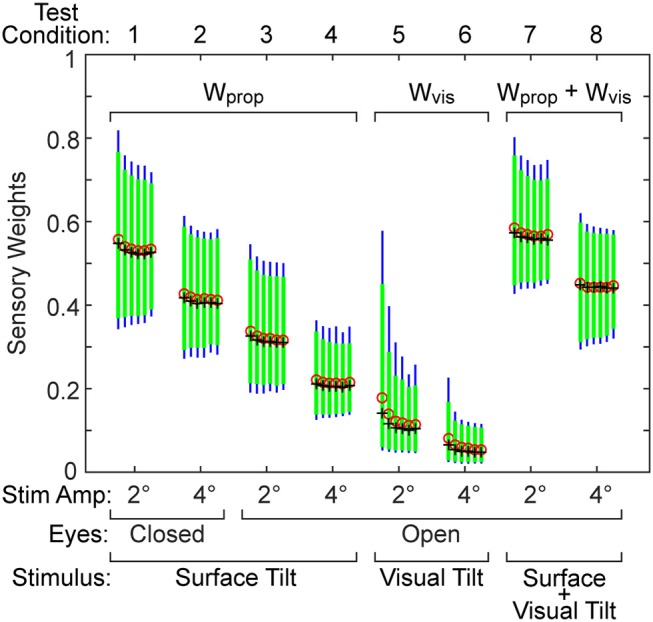
Figure 4.

Results from a bootstrap analysis used to investigate how test duration affects the distribution of the sensory weight parameter in the eight test conditions. The five vertical bars for each test condition represent the 90th percentile (thick green bar) and 95th percentile (thin blue bar) range of the parameter when results were derived from tests that included either 3, 6, 9, 11, 15, and 20 stimulus-response cycles (arranged left to right for each condition). Mean (red o) and median (black +) values of each distribution are shown.
