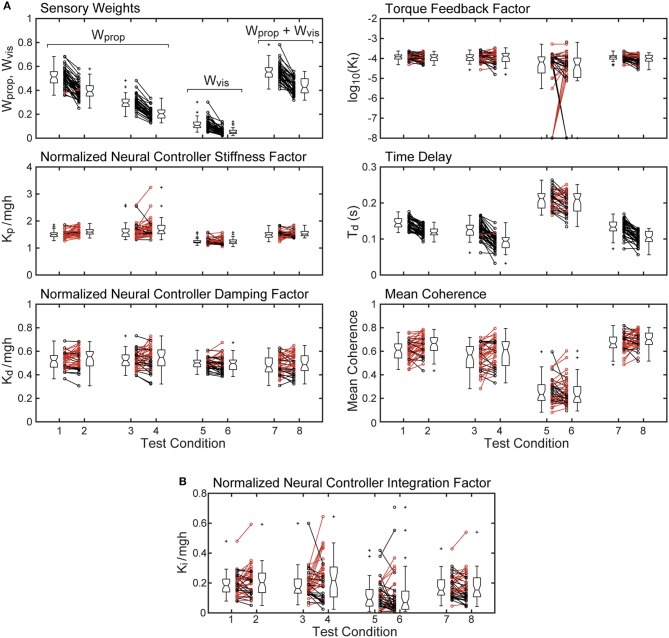
Figure 5.
Mean coherence and identified parameter values for the 8 test conditions from 40 subjects whose stimulus-response behavior was modeled using a proportional-derivative neural controller plus torque feedback are shown in (A). Subject data points from 2 and 4° stimulus-amplitude tests for the 4 test types are connected by lines with black lines and points indicating smaller parameter values on the 4° tests compared to the 2° tests and red lines indicating larger parameter values on the 4° tests. Boxplots next to the individual points show median values (center horizontal line), lower and upper 25th and 75th percentile values (lower and upper edges of the box), approximate 95% confidence limits on the median values (notches on the box), error bars (spanning smallest to largest individual values that are not considered to be outliers), and outlying data points (+'s). (B) shows values of the normalized integration control factor derived from model fits using a proportional-integral-derivative neural controller. Parameters from the single subject whose model fit for test condition five was not compatible with stability are not included.

