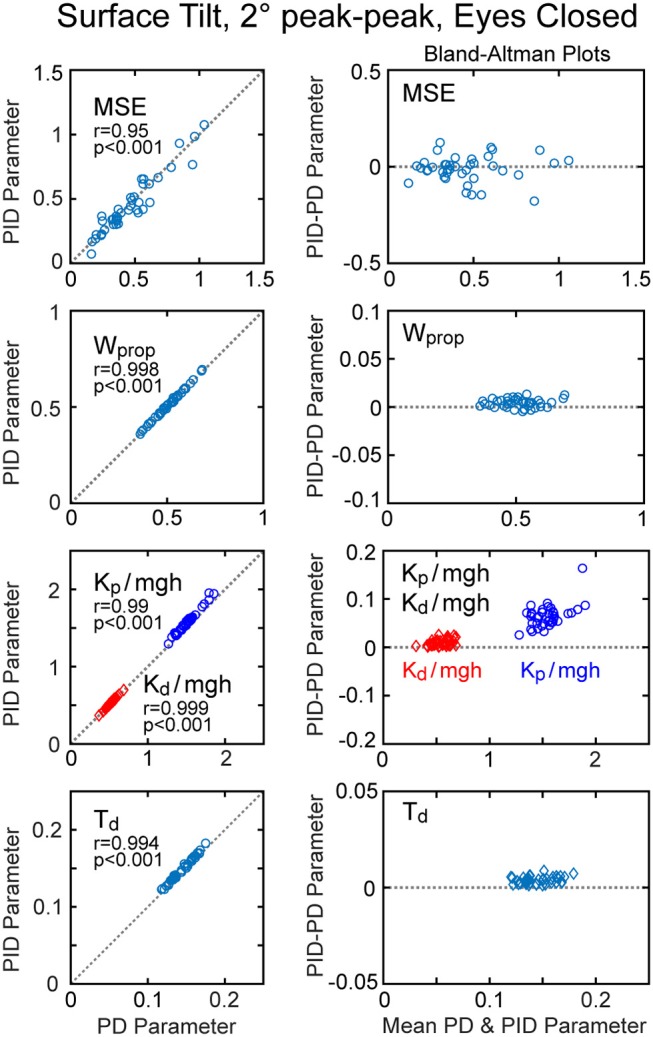
Figure 7.

Correlation and Bland-Altman plots comparing model fit mean square error (MSE) and parameters from the model with PD (proportional-derivative control) plus torque feedback with parameters from a PID (proportional-integral-derivative) model. Comparisons are shown for results from 40 subjects on the surface-tilt, eyes closed, 2° amplitude test.
