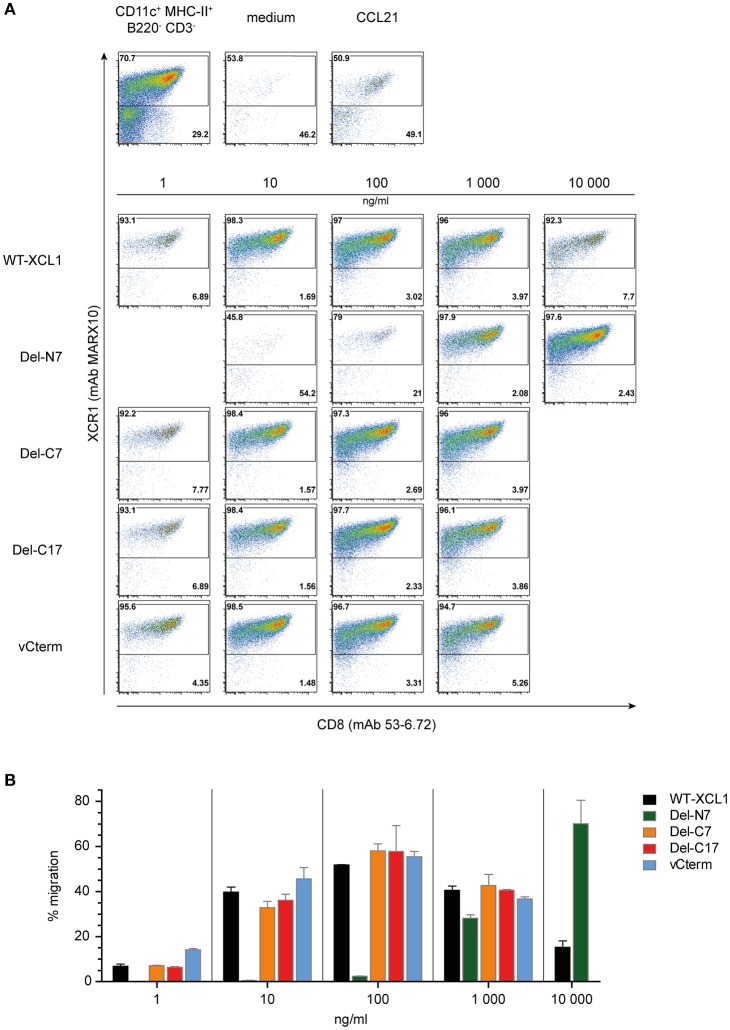
Figure 3.
Chemotaxis induced by XCL1-OVA and its variants Del-N7, Del-C7, Del-C17, and vCterm. (A) DC enriched from splenocytes by density gradient centrifugation were placed in the upper chamber of a transwell system, the composition of input DC is shown in the leftmost dotplot in the upper pannel. Various concentrations of wt XCL1-OVA and the structural variants were established in the lower chamber and migration of cells was allowed for 2 h. All concentrations are given based on the XCL1-component of the constructs. Thereafter, all cells from the lower chambers were quantitatively analyzed by flow cytometry after staining for XCR1 (mAb MARX10 binds to XCR1 independent of XCL1) and CD8 (mAb 53–6.2). Therefore, the number of events in the dot plots directly represent the number of cells detected. The effect of the negative (medium) and the positive controls (CCL21) is shown in the upper pannels of dot plots. (B) Quantitave evaluation of migrated XCR1+ DC expressed as percentage of input XCR1+ DC of the experiment shown in (A). One experiment representative of 2 independent experiments (each independent experiment was done in duplicate on the same day and the data were combined (mean ± SEM).

