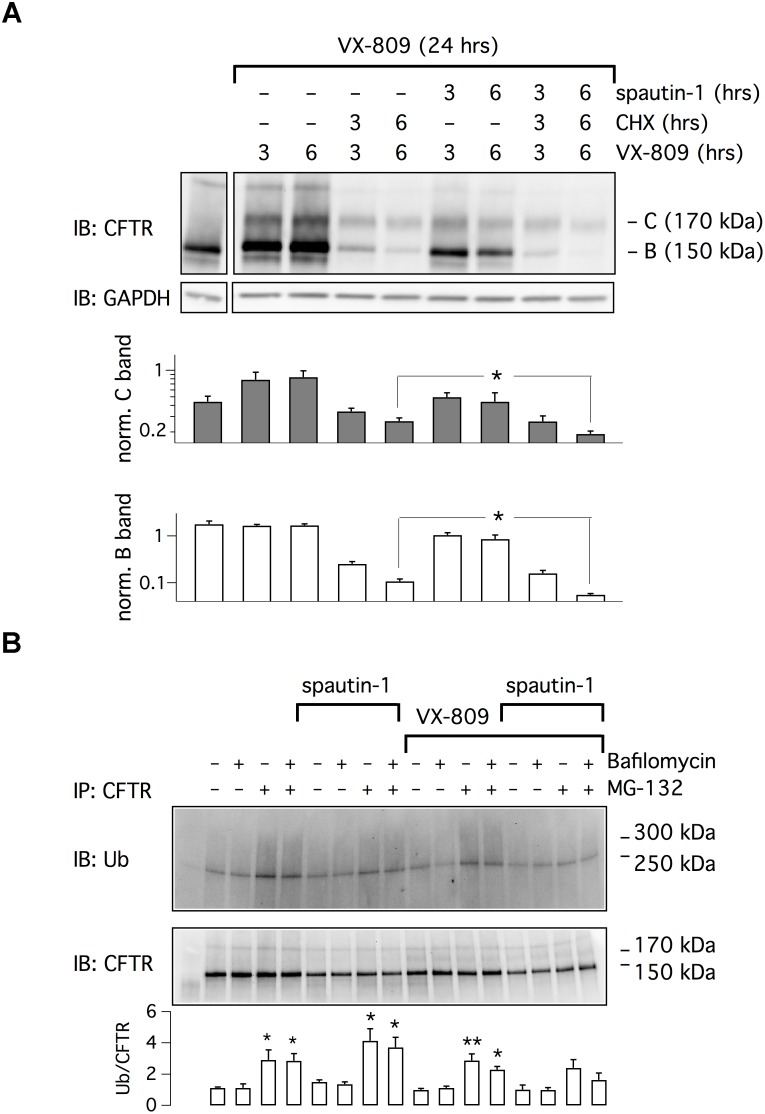
FIGURE 3.
Analysis of spautin-1 mechanism of action. (A) Spautin-1 in the presence of protein synthesis block. The image shows a representative western blot experiment done on lysates of CFBE41o- cells treated with VX-809 (1 μM) for 24 h and, in the last 3 or 6 h, with CHX (150 μg/ml), with spautin-1 (20 μM), or with both compounds together. To apply the different conditions, the entire medium was replaced at 3 or 6 h with fresh medium containing the required compounds, including VX-809. Therefore, the times indicate for VX-809 (3 and 6 h) simply indicate the time of medium replacement (the total time of VX-809 treatment was kept at 24 h). The pattern of lysates from cells treated with vehicle alone (no corrector) for 24 h is also shown (first separate lane on the left). Bar graphs show densitometry of bands C and B, normalized for GAPDH intensity, from three independent experiments. Spautin-1 caused a significant downregulation of F508del-CFTR signal in CHX-treated cells (∗p < 0.05). (B) Evaluation of spautin-1 on ubiquitinated F508del-CFTR. The image shows immunodetection of CFTR and ubiquitin in cell lysates after immunoprecipitation using an anti-CFTR antibody. Where indicated, cells where treated with VX-809 (1 μM) for 24 h and, in the last 3 h, with MG-132 (10 μM), bafilomycin A1 (100 nM), and/or spautin-1 (20 μM). The image is representative of three similar experiments. The bar graph shows the ratio of ubiquitin to CFTR signals (n = 3 separate experiments; ∗p < 0.05; ∗∗p < 0.01 vs. corresponding condition without MG-132 and bafilomycin).

