Figure 1.

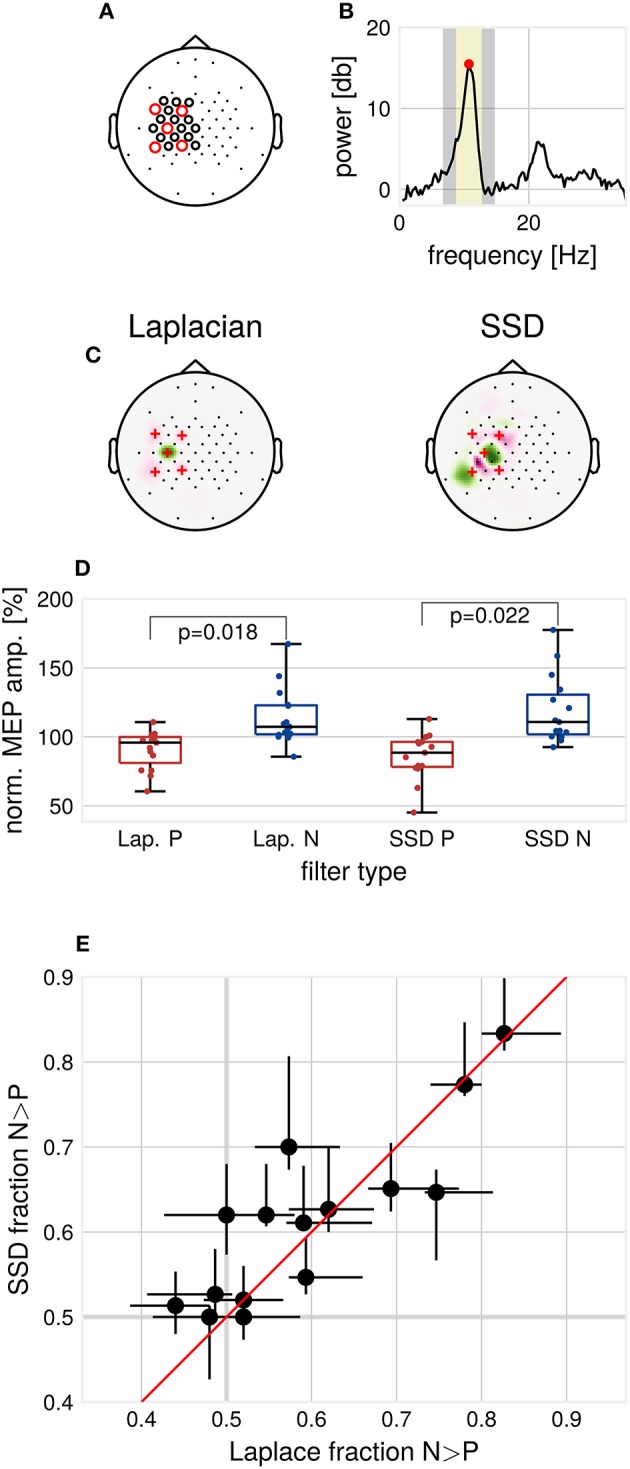
Methods and results. (A) EEG cap layout. Channels used for estimation of the individual spatial filters are marked with circles. Red circles indicate the channels used for determination of individual μ-peak-frequency. (B) Example 1/f-corrected spectrum used for determination of individual μ-peak frequency. Frequency bands used for the computation of SSD filters. Marked in yellow are the individual μ-peak frequency ±2 Hz, in gray the flanking noise frequency bands. (C) Example SSD spatial filter (right) computed from resting state EEG activity and the standard C3-centered Laplacian filter (left). (D) Group median MEP amplitudes for the respective filters, normalized by global median. p-values for Wilcoxon signed-rank test, multiple comparison corrected for the two types of filters, N = 15. (E) Modulation of MEP amplitudes by μ-phase as assessed by the N/P fraction for the respective filters, Laplace N/P-fraction vs. SSD N/P-fraction with 2.5–97.5th-percentile confidence intervals for each subject, N = 15.
