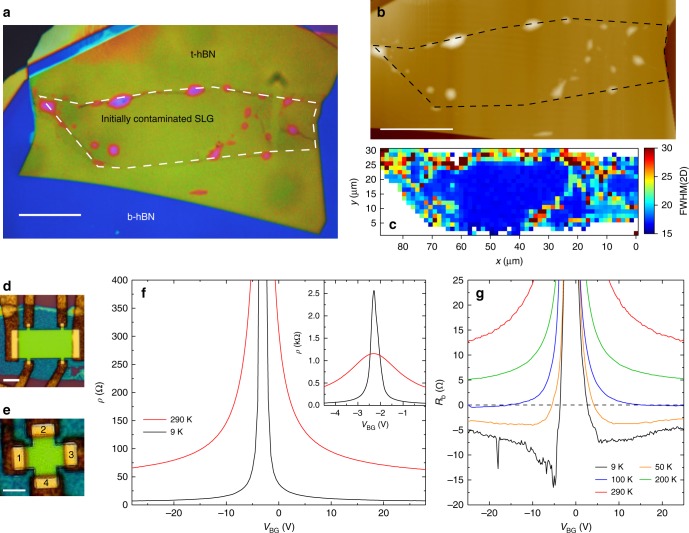
Fig. 8.
Characterization of heterostructures produced using SLG exposed to both polymer residuals and solvents. a False color optical image. SLG is indicated by the white dashed line. Blisters have been pushed to the SLG edges. Scale bar 20 μm. b AFM scan of the sample. The black dashed line shows the SLG. c Spatial map of FWHM(2D) of the sample, taken at an excitation wavelength of 514 nm. d Hall bar processed from the sample. Scale bar 5 μm. e Hall cross with arm width 2 μm from the same heterostructure. Scale bar 2 μm. The contacts are labeled 1–4. f Resistivity at 9 and 290 K. Inset: Resistivity at 9 and 290 K plotted close to CNP. g Bend resistance measurements of Hall cross in b as a function of temperature

