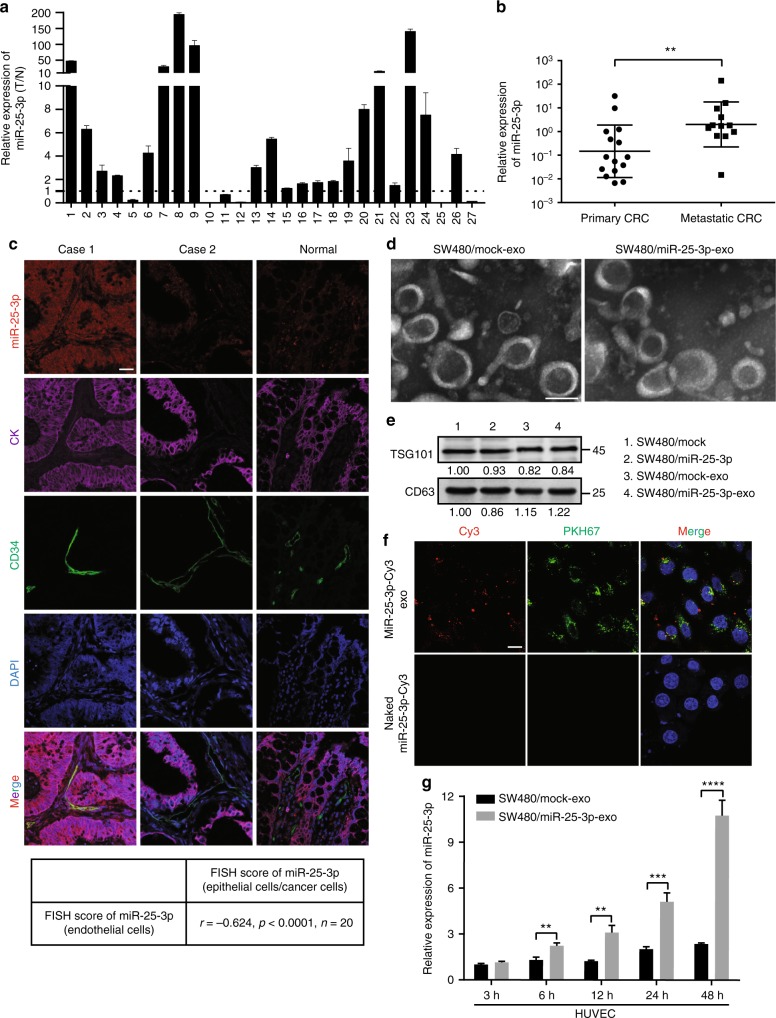
Fig. 1.
CRC-secreted miR-25-3p is transferred to endothelial cells. a RT-PCR analysis of miR-25-3p expression in 27 paired fresh CRC tissues and matched adjacent normal mucosa. The expression of miR-25-3p in normal mucosa was normalized to 1. Mean ± SEM are provided (n = 3). b RT-PCR analysis of miR-25-3p expression in 27 cases of the primary CRC tissues with or without metastasis (17 cases without metastasis, 10 cases with metastasis). Mean ± SEM are provided. c Correlation analysis of miR-25-3p (red) expression in colorectal epithelial cells/cancer cells (labeled by CK, purple) and their adjacent endothelial cells (labeled by CD34, green). MiR-25-3p levels were determined by FISH and scored as described in Methods. Pearson’s correlation coefficient (r) and P-value are shown (n = 20). P-value is from Spearman’s test. Scale bar represents 50 µm. d Transmission electron microscopy of exosomes derived from SW480/mock and SW480/miR-25-3p. Scale bar represents 50 nm. e Western blotting analysis of TSG101 and CD63 in SW480/mock, SW480/miR-25-3p and their exosomes. f The top panels show presence of Cy3 fluorescence and PKH67 lipid dye in HUVECs after adding PKH67-labeled exosomes derived from SW480 cells for 48 h. HUVECs incubated with naked-miR-25-3p-Cy3 were used as a negative control (the bottom panels). Scale bar represent 10 µm. g RT-PCR analysis of miR-25-3p expression in HUVECs incubated with exosomes derived from SW480/mock and SW480/miR-25-3p for 3 h, 6 h, 12 h, 24 h, and 48 h. Mean ± SEM are provided (n = 3). **P < 0.01, ***P < 0.001, ****P < 0.0001 according to two-tailed Student’s t test

