Fig. 5.
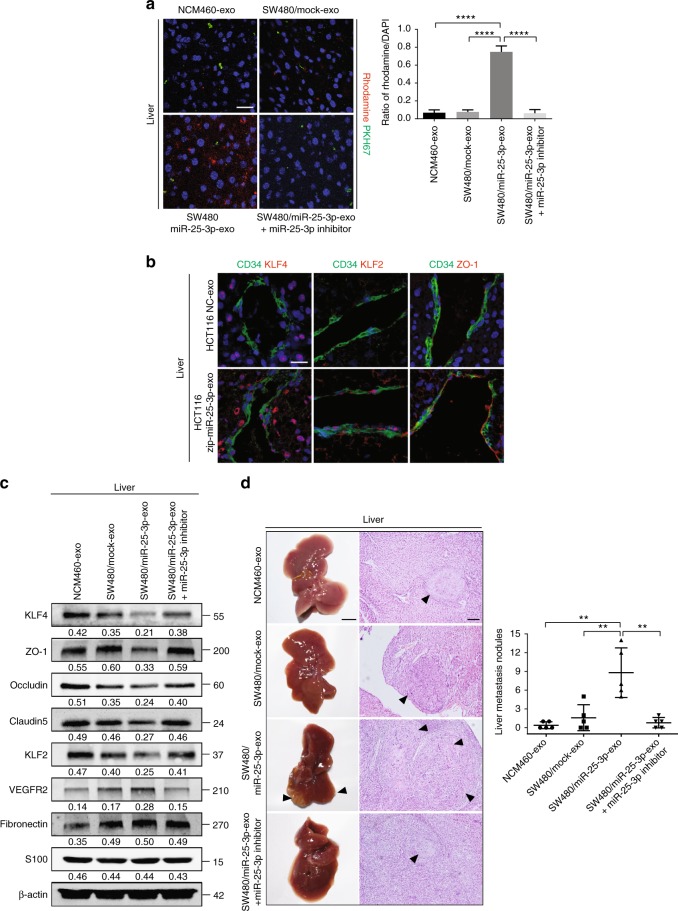
CRC-secreted miR-25-3p primes pre-metastatic niche. a Effects of NCM460 exosomes, SW480/mock exosomes, SW480/miR-25-3p exosomes, SW480/miR-25-3p exosomes + miR-25-3p inhibitor treatments on vascular permeability of mice liver by in vivo permeability assay. The mice were injected with rhodamine–dextran after exposure to PKH67-labeled exosomes. Levels of rhodamine–dextran fluorescence in tissues were quantified using Image J software and normalized to the levels of DAPI. Mean ± SEM are provided (n = 5). Scale bar represents 50 µm. b Effects of NCM460 exosomes, SW480/mock exosomes, SW480/miR-25-3p exosomes, SW480/miR-25-3p exosomes + miR-25-3p inhibitor treatments on vascular KLF4, KLF2, and ZO-1 expression (red) in hepatic vessels by immunofluorescence. The vascular structures were labeled by CD34 (green). Scale bar represents 50 µm. c Effects of NCM460 exosomes, SW480/mock exosomes, SW480/miR-25-3p exosomes or SW480/miR-25-3p exosomes + miR-25-3p inhibitor treatments on KLF4, ZO-1, occludin, Claudin5, KLF2, VEGFR2, fibronectin, and S100 expression in mice liver by Western blot. d The mice were intra-spleen injected with naked SW480 cells after exposure to NCM460 exosomes, SW480/mock exosomes, SW480/miR-25-3p exosomes or SW480/miR-25-3p exosomes + miR-25-3p inhibitor treatments. The number of liver metastatic sites (indicated by arrows) was counted under the microscope. Mean ± SEM are provided (n = 5). Scale bar in left panels represents 0.5 cm. Scale bar in right panels represents 100 µm. **P < 0.01, ****P < 0.0001 according to two-tailed Student’s t test

