Fig. 3.
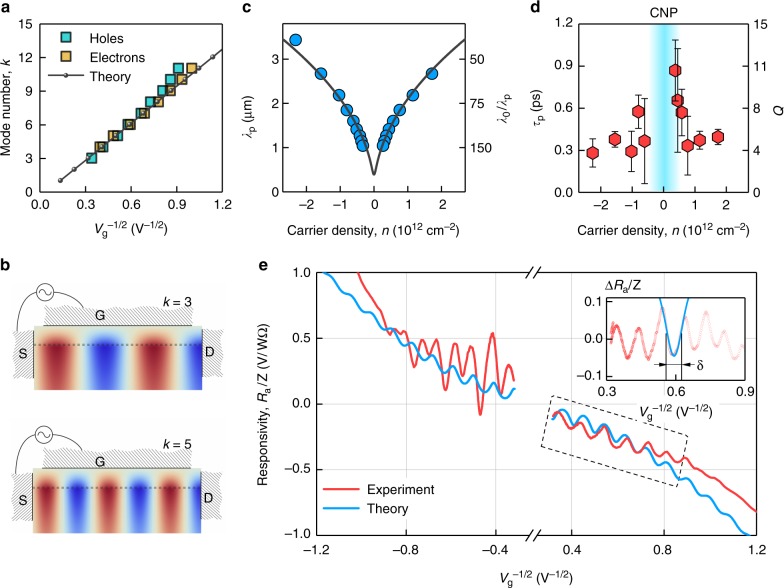
Plasmon resonances in encapsulated graphene FET. a Mode number k as a function of (symbols). Solid line: theoretical dependence for L = 6 μm, m = 0.036me, and f = 2 THz. The first mode supported by our Fabry-Pérot plasmonic cavity corresponds to kmin = 3; the fundamental mode with k = 0 is beyond the accessible gate voltages. b Examples of high-frequency potential distribution in the plasmon mode (real part) under resonant conditions for given k. Brown and blue colors represent positive and negative values of electrical potential, respectively. S, G, and D stand for source, gate, and drain terminals, respectively. c Experimental (symbols) and calculated (solid line) plasmon wavelengths λp as a function of carrier density, as obtained from a. The corresponding value of the inverse compression ratio, λ0/λp, for f = 2 THz is given on the right axis. d Plasmon lifetime τp and quality factor Q as obtained from the width of the resonances shown in e. Error bars stem from the fitting procedure. e Experimental and calculated responsivities as functions of , normalized to the effective antenna impedance relating the incident power to the resulting gate-to-channel voltage Va. The theoretical Dyakonov-Shur dependence (Supplementary Note 9) was obtained by using characteristic τp = 0.6 ps from d. Inset: normalized responsivity Ra/Z after the subtraction of a smooth non-oscillating background. The solid blue line is the best Lorentzian fit to the data, with δ = 0.1 V−1/2, which translates to τp = 0.5 ps

