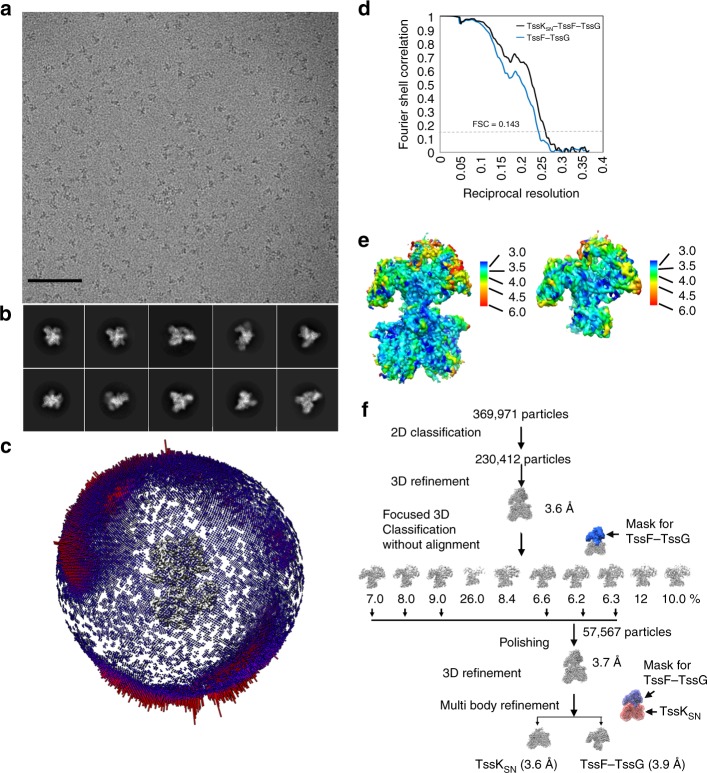
Fig. 2.
CryoEM characterization of the EAEC TssKSN–TssF–TssG complex. a Micrograph of frozen-hydrated particles adsorbed on a thin layer of carbon. Scale bar: 100 nm. b Reference-free 2D class averages. c Distribution of orientations of particle images used for the final reconstruction. d Gold-standard Fourier shell correlation curves for the global reconstruction (black) and the reconstruction focused on (TssF)2-(TssG)1 (blue). The 0.143 cutoff is indicated in gray. e Local resolution estimates of the global and TssF-TssG focused maps. f Flow-chart summarizing the data processing strategy employed

