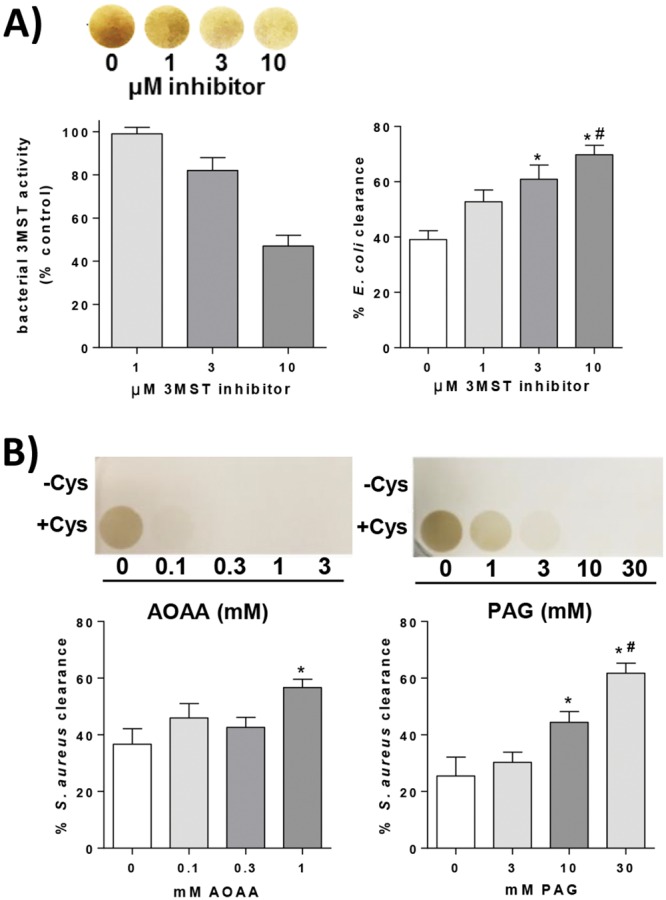
FIG 2.

(A) Image showing brown lead sulfide staining produced by reaction of lead acetate with H2S produced by E. coli cultured with or without the 3-MST inhibitor. The graph on the left shows the activity of bacterial 3MST in the presence of increasing concentrations of the 3-MST inhibitor, expressed as a percentage of 3MST activity in the control (no inhibitor) (n = 3 replicates/group). The graph on the right shows in vitro elimination of E. coli by leukocytes after 45 min. WT E. coli bacteria were cultured in the presence of the 3-MST inhibitor prior to inoculation of leukocytes. *, significantly different from 0 μM; #, significantly different from 1 μM (n = 5/group). (B) Brown lead sulfide stain produced by reaction of lead acetate with H2S from S. aureus cultured with or without increasing concentrations of AOAA or PAG, in the presence (+Cys) or absence (−Cys) of 200 µM cysteine supplementation. Graphs show in vitro elimination of S. aureus by leukocytes after 60 min. WT S. aureus bacteria were cultured with inhibitors prior to inoculation of leukocytes. *, significantly different from 0 mM; #, significantly different from 3 mM (n = 5/group).
