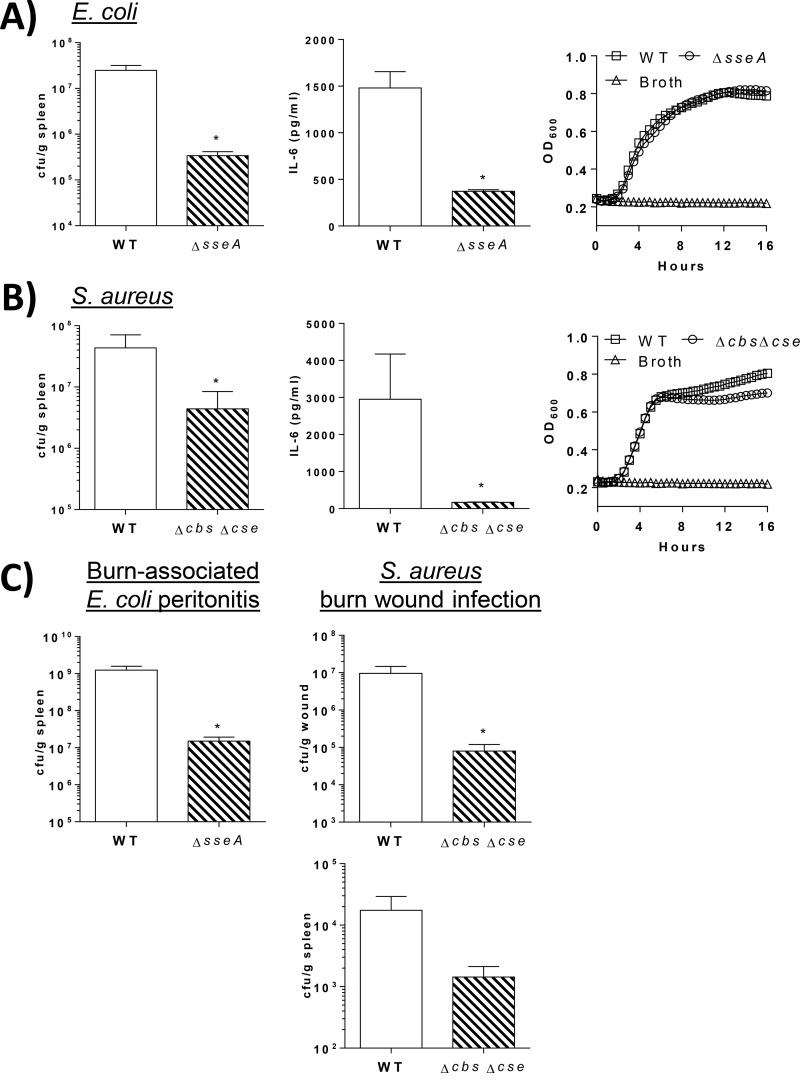
FIG 5.
(A, left) Bar graphs showing bacterial counts in spleen and IL-6 levels in plasma 16 h after i.p. injection of mice with 1 × 10⁸ CFU E. coli. *, significantly different from the WT (n = 5 mice/group). (Right) Densities of E. coli WT and ΔsseA bacteria in liquid cultures, measured by the OD600 over 16 h. (B, left) Bar graphs showing bacterial counts in spleens and plasma IL-6 levels in mice 16 h after i.p. injection of 5 × 10⁸ CFU S. aureus. *, significantly different from the WT (n = 5/group). (Right) Densities of S. aureus WT and Δcbs Δcse bacteria in liquid cultures, measured by the OD600 over 16 h. (C, left) Graph showing bacterial counts in spleens of burned mice 16 h after i.p. injection of mice with 1 × 10⁸ CFU E. coli. *, significantly different from the WT (n = 5 mice/group). (Right) Graphs showing bacterial counts in burn wounds and spleens of mice 24 h after inoculation of wounds with 1 × 10⁶ CFU S. aureus. *, significantly different from the WT (n = 3 to 4/group).

