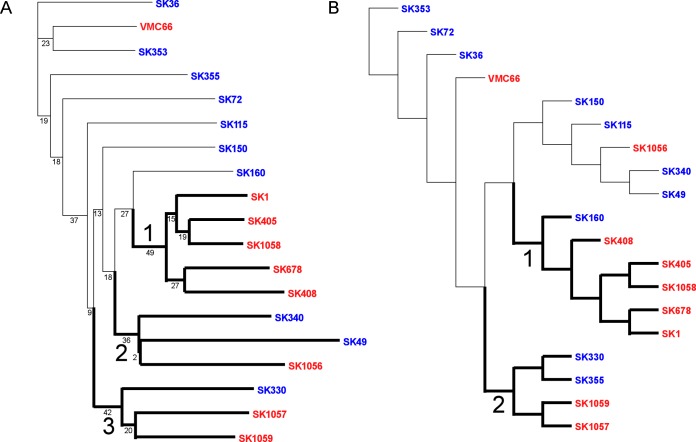
FIG 2.
Phylograms computed by PGAP using the neighbor-joining method of clustering. Clades are labeled and accentuated by darker branches emanating from the clade’s most basal node. Red indicates blood isolates, and blue denotes oral isolates. (A) Pangenome-based phylogram created using a gene distance matrix approach built upon gene presence or absence in each strain. (B) SNP-based phylogram created from analysis of core genes lacking paralogs.

