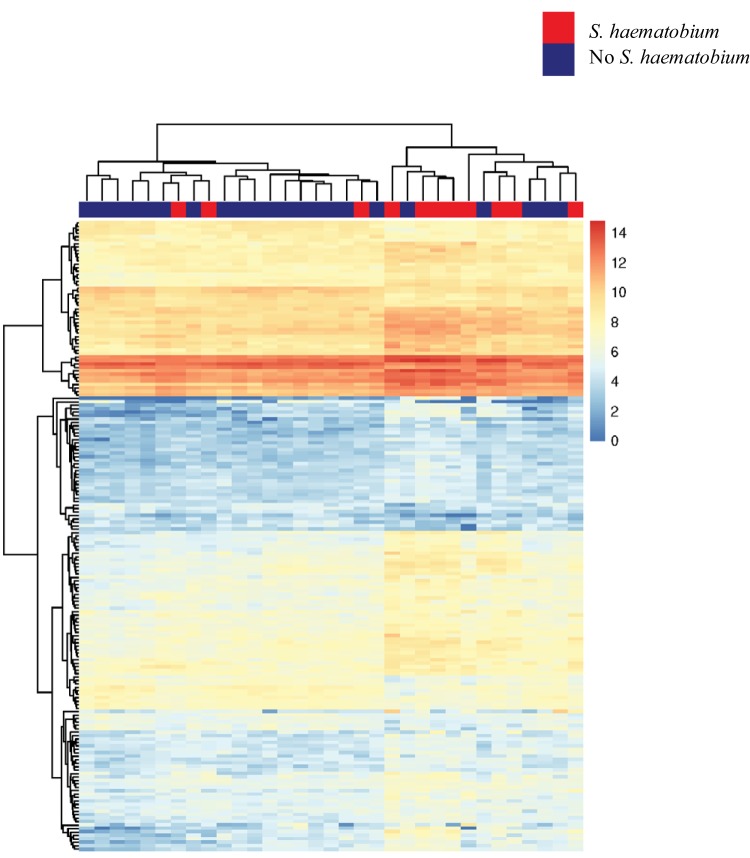
FIG 2.
Genes with at least 1.5-fold changes in expression between individuals with and without S. haematobium infection. In this heat map generated with unsupervised clustering, data for individuals with S. haematobium infection are indicated in red along the top horizontal bar, and data for individuals without S. haematobium infection are indicated in blue.

